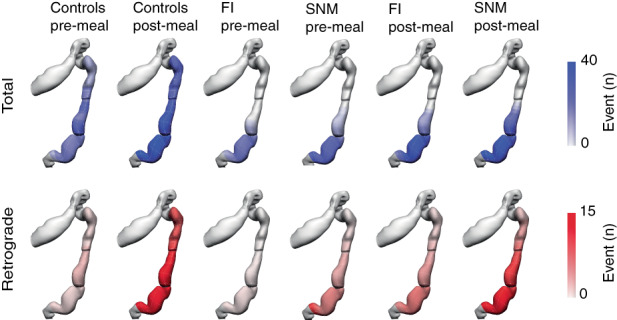
FIGURE 4.

Anatomical registration of the event count distribution into a colonic geometry model, based on the estimated catheter insertion position. The colours represent the mean number of propagating events per hour. Propagating contractions were most active in the sigmoid colon. Total propagating contractions are depicted in blue and retrograde propagating contractions are depicted in red. FI, faecal incontinence; SNM, sacral neuromodulation.
