
Figure 2.
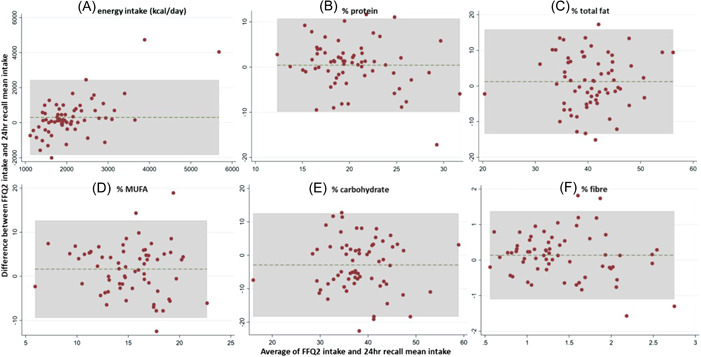
Bland–Altman plots indicating non‐significant or negligible bias when comparing the energy‐adjusted daily macro‐ and micronutrients intake 1 year later (FFQ2) with the 24‐h recall mean intakes for (a) energy (kcal day–1): mean difference (MD) = 300.98, 95% confidence interval (CI) = 30.18–571.79; (b) % protein: MD = 0.97, 95% CI = −0.87–1.74; (c) % total fat: MD = 1.23, 95% CI = −0.62, 3.08; (d) % monounsaturated fatty acids (MUFA): MD = 1.63, 95% CI = 0.24, 3.02; (e) % carbohydrate: MD = −2.89, 95% CI = −4.85 to −0.94; and (f) % fibre: MD = 0.16, 95% CI = −0.05, 0.36. The solid line represents the mean difference between the two methods used (FFQ and 24‐h recalls), whereas the dashed line represents the distance between the limits of agreement (mean difference ± 2 SD). FFQ, food frequency questionnaire.