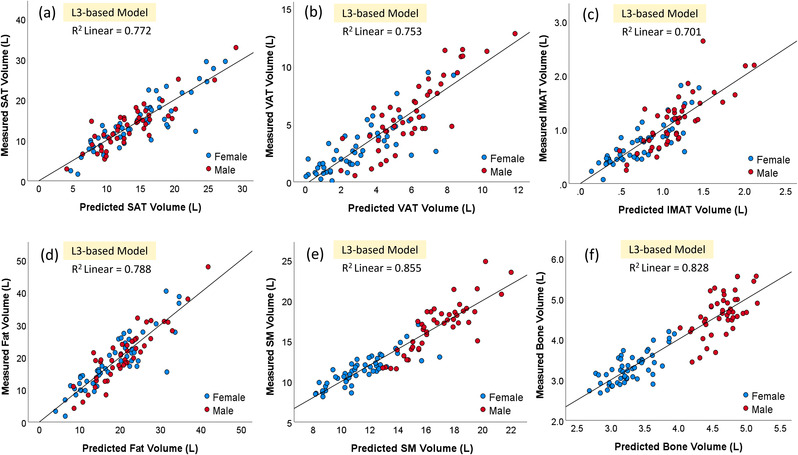
FIGURE 4.

Scatter plots of the five body tissues ((a): SAT, (b): VAT, (c): IMAT, (d): total fat, (e) SM, and (f) bone) computed from whole‐body positron emission tomography‐computed tomography (PET‐CT) scans and body tissue areas predicted from the third lumbar (L3)‐based models. IMAT, intermuscular adipose tissue; SAT, subcutaneous adipose tissue; SM, skeletal muscle; VAT, visceral adipose tissue
