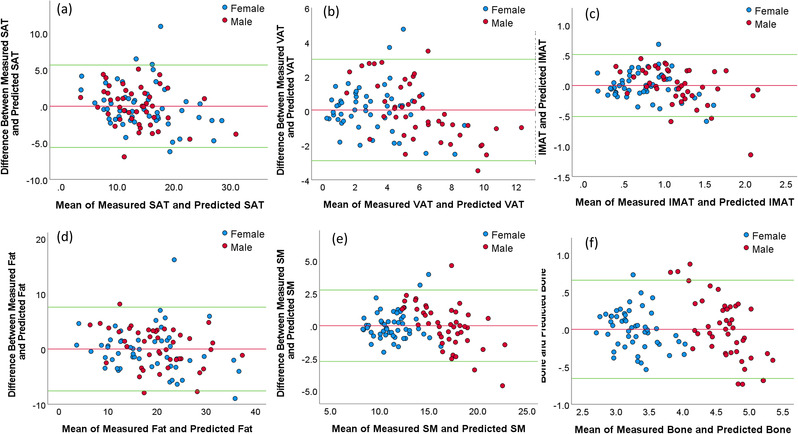
FIGURE 6.

The Bland–Altman plots showing the agreement between the measured values (unit: L) from the whole‐body computed tomography (CT) scans and the predicted values (unit: L) from the third lumbar (L3)‐based model for different body ((a): SAT, (b): VAT, (c): IMAT, (d): total fat, (e) SM, and (f) bone). The horizontal red line shows the mean of the differences (=bias) between the two methods. The green horizontal lines show the upper and lower 95% limits of agreement (=bias ± 1.96 × SD).
