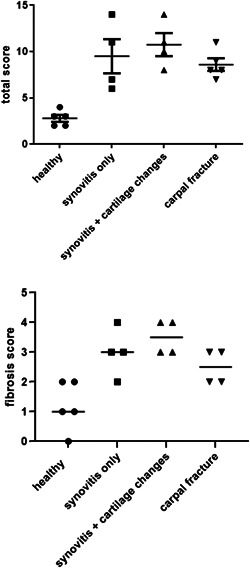
Figure 1.

Total synovitis score and fibrosis score for the healthy and OA groups classified according to McIlwraith et al. 28 Bars show means ± SD. Mean total score for healthy joints was lower than means for OA joints (p < 0.01) but the OA group means did not differ from each other (p = 0.50). Mean fibrosis score was lower for healthy joints than for OA joints (p < 0.001) but the OA group means did not differ from each other (p = 0.16). OA, osteoarthritis
