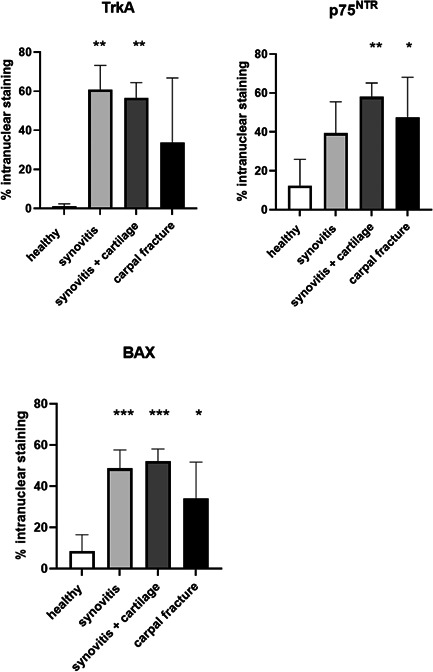
Figure 2.

TrkA: Quantification of nuclear staining of TrkA. Staining is increased in the groups with synovitis (61% ± 12) and synovitis + articular cartilage changes (57% ± 8) compared to healthy (1% ± 1). p75NTR: Quantification of nuclear staining of p75NTR. Staining is increased in the synovitis + articular cartilage changes group (58% ± 7) and in the intracarpal fracture group (48% ± 21) compared to healthy (12% ± 14). BAX: Quantification of nuclear staining of BAX. Staining is increased in all synovitis groups (49% ± 9 for synovitis only, 52% ± 6 for synovitis and articular cartilage changes and 34% ± 18 for intracarpal fractures) compared to healthy (9% ± 8). There were no statistical differences in mean nuclear staining between different synovitis groups for either receptor. Bars indicate SD from mean. Asterisks indicate statistically significant difference from healthy; *p < 0.05, **p < 0.01, ***p < 0.001. BAX, Bcl‐2‐Associated X protein; p75NTR, pan‐neurotrophin receptor; TrkA, tyrosine kinase A
