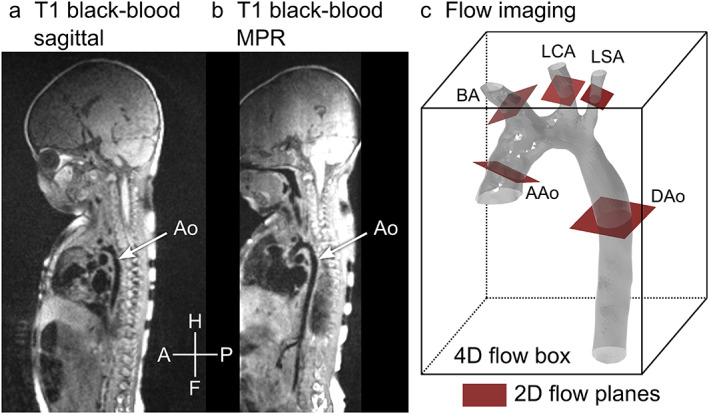
FIGURE 2.

Overview and scan planning. Panel (a) shows a T1‐weighted black‐blood image taken in the sagittal view. A stack of such images was used to find locations for 2D flow measurement. The aorta is partially visible. Panel (b) shows the same image stack displayed at an angle using multiplanar reformatting (MPR), with a better view of the aorta. Panel (c) shows schematically how flow imaging was performed. The gray mesh shows a 3D model of the aorta, the box represents a 4D flow measurement covering the whole aorta and the red squares show locations where 2D flow was acquired. H/F = head/feet, A/P = anterior/posterior. AAo = ascending aorta, Dao = descending aorta, BA = brachiocephalic artery, LCA = left carotid artery, LSA = left subclavian artery, MPR = multiplanar reconstruction.
