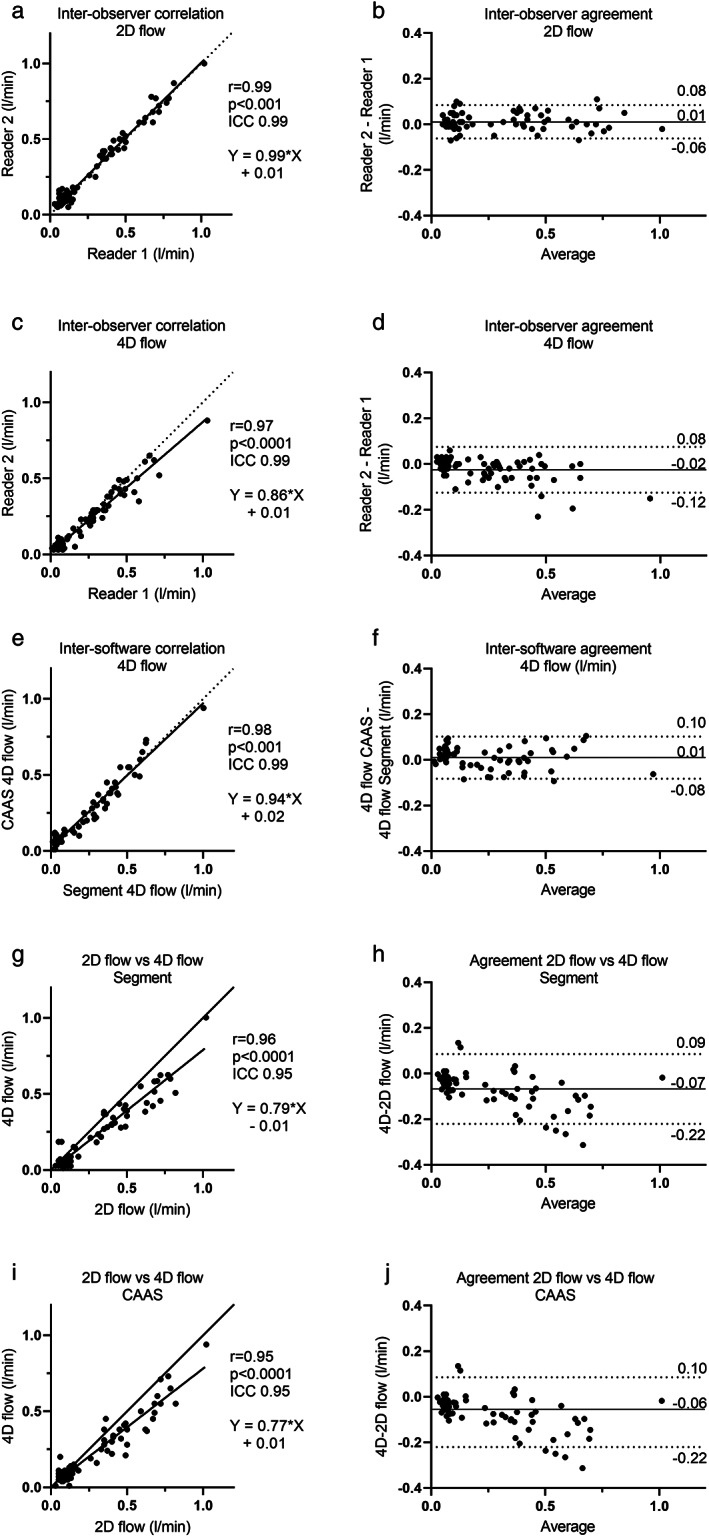
FIGURE 5.

Quantitative flow results. (a) Scatter plot of 2D flow measurements showing agreement between readers. (b) Bland–Altman plot of 2D flow measurements showing interobserver agreement with a bias of 0.01 ± 0.04 liter/min. (c) Scatter plot of 4D flow measurements showing agreement between readers. (d) Bland–Altman plot of 4D flow measurements showing interobserver agreement with a bias of −0.02 ± 0.05 liter/min. Panel (e) scatter plot of 4D flow measurements showing correlation between different software. (f) Bland–Altman plot of 4D flow measurements showing intersoftware agreement with a bias of 0.01 ± 0.05 liter/min. (g,i) Scatter plot showing correlation between 2D flow and 4D flow using CAAS MR solutions (g) and segment. (h,j) Bland–Altman plot showing that 4D flow volumes analyzed either with segment (h) (bias of −0.07 ± 0.08) or CAAS Medical Solutions (j) (bias of −0.06 ± 0.08) was lower than 2D flow volumes.
