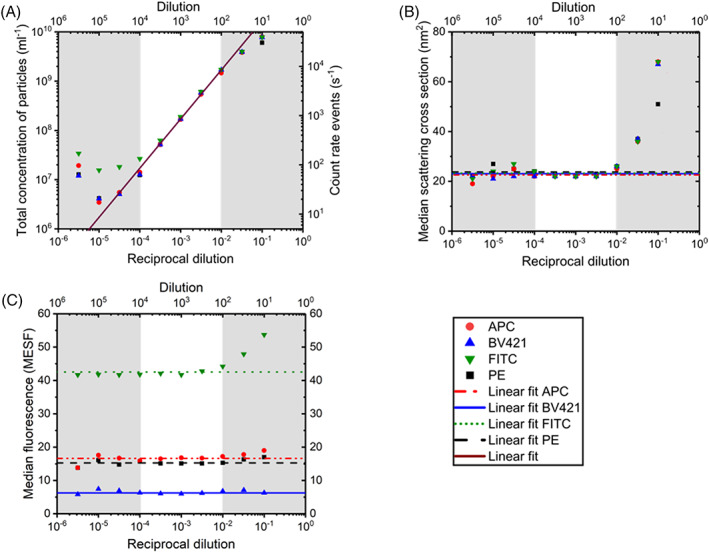
FIGURE 1.

Selecting the optimal dilution of pooled human plasma to prevent swarm detection. (A) Total concentration of particles, (B) median scattering cross‐section, and (C) median fluorescence measured by flow cytometry versus reciprocal fold dilution of pooled human plasma labeled with either Allophycocyanin (APC, VI‐PL2), Brilliant Violet‐421 (BV421, RUUPL7F12), fluorescein isothiocyanate (FITC, Y2/51), or phycoerythrin (PE, VI‐PL2). Total concentration and reciprocal dilution axes have logarithmic scales. The right vertical axis of (A) shows the count rate of events. The median fluorescence in (C) is expressed in molecules of equivalent soluble fluorochrome (MESF) for all fluorophores. Data points within the white area follow a linear trend, as expected, so linear fits for these data points are given. Data points in the gray areas are deviating from these fits due to domination of particles in the reagents (left gray area) or due to swarm detection (right gray area). For the linear fit in (A) the R 2 is 1.00 and the slope is 1.00. For the linear fits in (B, C) a fixed slope of 0 is used. The error bars overlap with the symbols, meaning that the standard deviations are small and therefore omitted. The 316‐fold dilution is considered optimal since it detects the highest concentration of particles without swarm detection. [Color figure can be viewed at wileyonlinelibrary.com]
