
FIGURE 2.
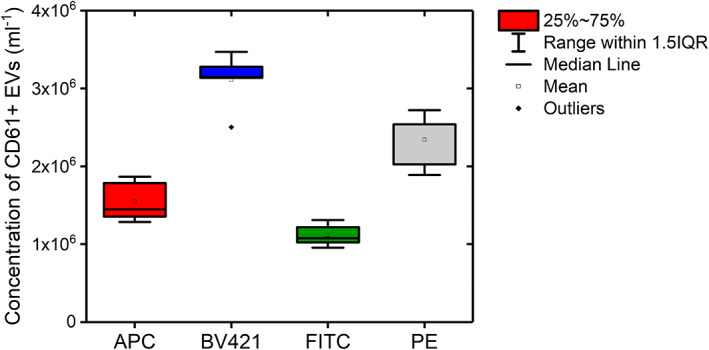
Concentration of CD61+ extracellular vesicles (EVs) measured by flow cytometry in 316‐fold diluted pooled human plasma labeled with Allophycocyanin (APC, VI‐PL2), Brilliant Violet‐421 (BV421, VI‐PL2), fluorescein isothiocyanate (FITC, VI‐PL2), or phycoerythrin (PE, VI‐PL2). The boxplot shows the CD61+ EV concentrations resulting from gates defined by five independent experts. Both the mean and median values of the concentration of CD61+ EVs gated by different experts are represented, as well as the interquartile range and outliers. Results do not only show variability in concentrations of CD61+ EVs detected by different fluorophores, but also between experts when analyzing exactly the same data. [Color figure can be viewed at wileyonlinelibrary.com]