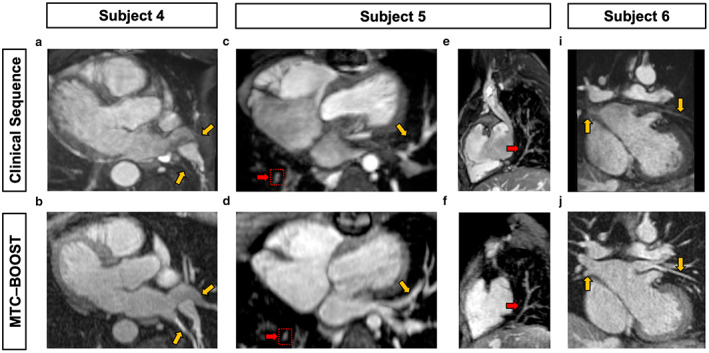
FIGURE 3.

Comparison of MTC‐BOOST and standard T2prep 3D Whole Heart datasets in three representative patients for pulmonary vein imaging. Yellow arrows mark the sites of PVs draining into the LA. Subject 4 has surgically corrected partial anomalous pulmonary venous drainage (PAPVD), with poor delineation of the PVs using standard imaging (a) which are clearly visualized using MTC‐BOOST (b). Subject 5 has scimitar syndrome with an anomalous right pulmonary vein draining to the inferior vena cava. The left sided PVs (yellow arrows) are again poorly visualized with standard imaging (c) but clearly delineated with MTC‐BOOST (d). In the same patient, the anomalous right sided PV is clearly delineated in both sequences (red arrows, c–f). Subject 6 has PA hypoplasia, with luminal signal loss of both left and right sided PVs with the T2prep‐3DWH sequence (g) that is not apparent with MTC‐BOOST, where there is clear delineation of the PVs throughout their course (h). PV = pulmonary vein; PA = pulmonary artery; LA = left atrium.
