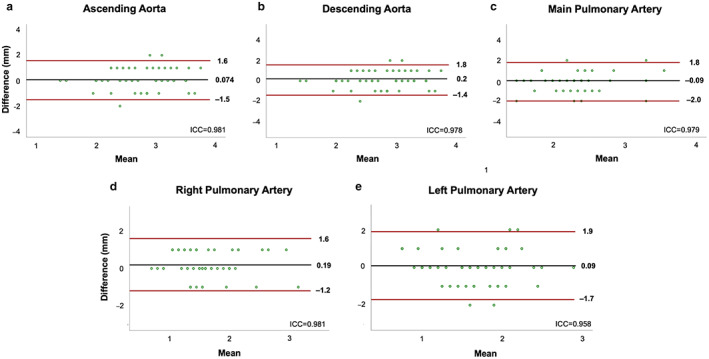
FIGURE 6.

Bland–Altman plots for vessel dimension assessment comparing MTC‐BOOST and T2prep‐3DWH imaging sequences. Bland–Altman assessment of maximal co‐axial vessel dimensions of (a) ascending aorta at the level of the RPA, (b) descending thoracic aorta at the level of the RPA, (c) main pulmonary artery, (d) right pulmonary artery and (e) left pulmonary artery derived from multiplanar reformats of bright‐blood MTC‐BOOST and standard T2prep‐3DWH datasets. Black lines denote mean difference and red lines denote 95% CI (±1.96 SD). Intraclass correlation coefficients (ICC) between T2prep‐3DWH and MTC‐BOOST are included. RPA = right pulmonary artery; MTC = magnetization transfer contrast.
