
FIGURE 2.
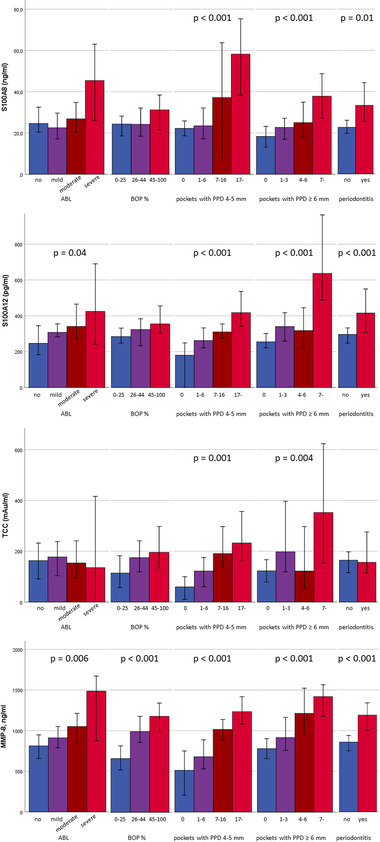
Concentrations of salivary proteins in subgroups of study participants. Concentrations are expressed as medians. Error bars represent 95% confidence intervals. Comparisons between the groups were made by the Kruskal‐Wallis test
Official websites use .gov
A
.gov website belongs to an official
government organization in the United States.
Secure .gov websites use HTTPS
A lock (
) or https:// means you've safely
connected to the .gov website. Share sensitive
information only on official, secure websites.
Concentrations of salivary proteins in subgroups of study participants. Concentrations are expressed as medians. Error bars represent 95% confidence intervals. Comparisons between the groups were made by the Kruskal‐Wallis test