
FIGURE 4.
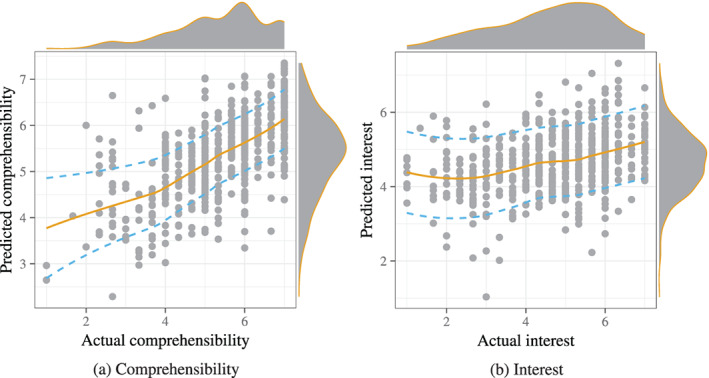
Predictive performance of statistical models for comprehensibility (a) and interest (b) in a leave‐one‐out cross‐validation setting. The scatterplots show the actual and predicted values, accompanied by a trend line and 95% confidence intervals for the predictions. Above and to the right of the scatter plots, density plots illustrate the distribution for the shown values