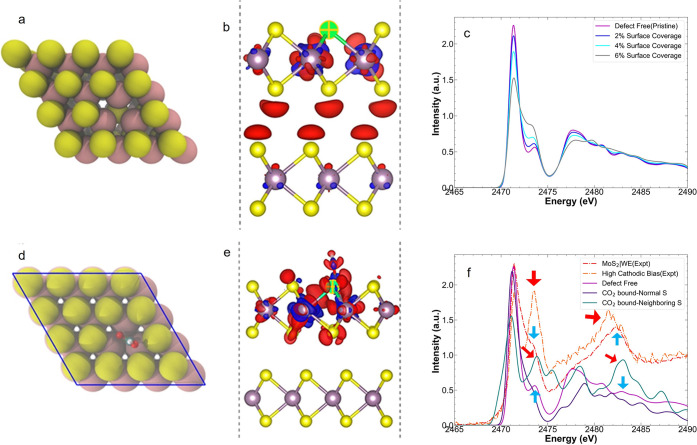
Figure 2.
Simulated spectroscopic signature of the binding of CO2 to MoS2. (a) Atomic representation of a single anionic vacancy (blank site) in MoS2. The Mo and S atoms are shown as pink and yellow spheres, respectively. (b) Representative differential excited state charge density of the S 1s → first conduction band excited electron. The dashed vertical lines indicate the unit cell boundaries. We adopt the convention that the increase in the density is colored blue, while reduction is colored red. The excited S atom is indicated by the green crossed symbol. (c) Simulated S K-edge XAS as a function of concentration of S vacancies. (d) Atomic structural representation of CO2 bound to Mo using a S-vacancy site in MoS2. The O and bound C atoms are shown as red and brown spheres, respectively. (e) Representative excited electron charge density. (f) Comparison of the S K-edge XAS, calculated using the defect-free MoS2 structure (purple line) and the structure with a CO2 bound to a S vacancy site (blue and teal). The experimental XAS of the MoS2 measured in the MoS2|WE and at high cathodic bias (−1.29 VRHE) are shown as a reference (red and orange dotted lines, respectively). The red arrows indicate the correspondence between the simulated XAS of the S atoms neighboring a CO2-bound vacancy and the high cathodic experiments, while the blue arrows indicate the correspondence between the simulated pristine MoS2 structure and the initial experimental measurement in the MoS2|WE.

