
Figure 1.
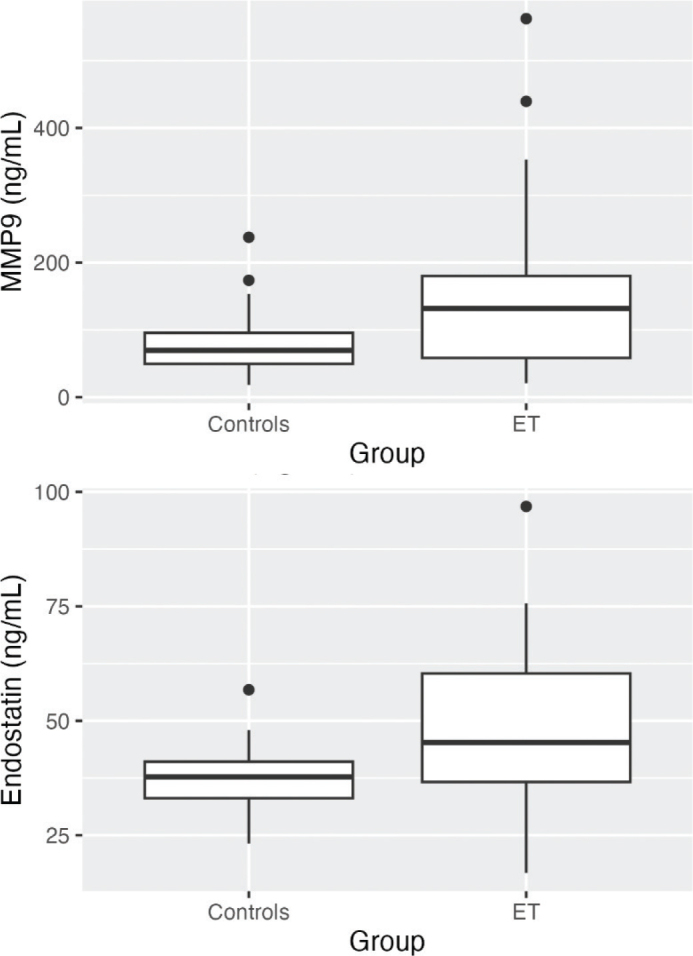
Boxplots visualizing plasma levels of (a) MMP9 and (b) endostatin in ng/mL in controls and ET patients. Medians are shown as thick lines, bottom and top boxes represent the first and third quartiles, whiskers show the smallest and highest non-outliers, and circles represent outliers. In (a) MMP9 in ET > Controls (P < 0.01) and in (b) Endostatin in ET > Controls (P < 0.001). Abbreviations: ET, essential thrombocythemia; MMP9, matrix metallopeptidase 9.