Figure 2.

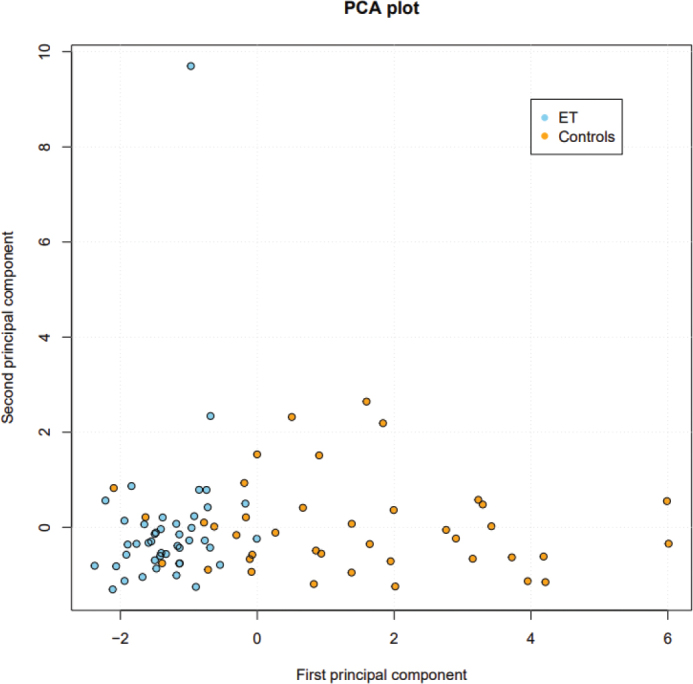
Principal component analysis plot showing homogenous expression of the eight angiogenesis-related proteins analyzed in essential thrombocythemia (ET) patients compared with controls. Controls, yellow dots. ET, blue dots.

Principal component analysis plot showing homogenous expression of the eight angiogenesis-related proteins analyzed in essential thrombocythemia (ET) patients compared with controls. Controls, yellow dots. ET, blue dots.