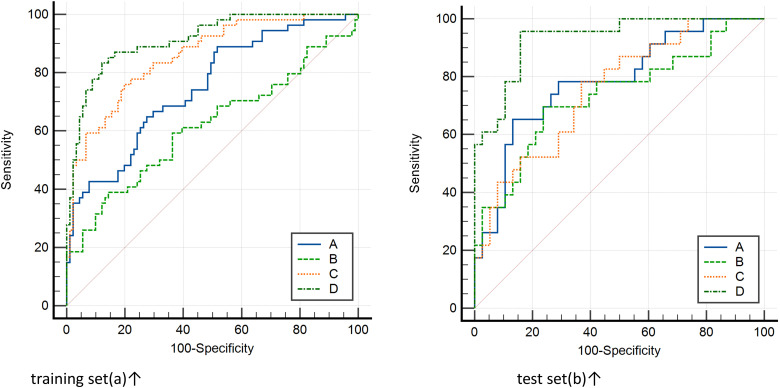
Figure 4.
Delong test method was used to compare the area under the curve of ROC between different prediction models of training set (left) and test set (right) and compare its effectiveness in predicting the biochemical recurrence (BCR). The area under the curve of the combined model was the largest. 19 Notes: The clinical model (A), contrast-enhanced ultrasound (CEUS) model (B), magnetic resonance imaging (MRI) radiomics model (C), and combined model (D). training set(a)↑ test set(b)↑.

