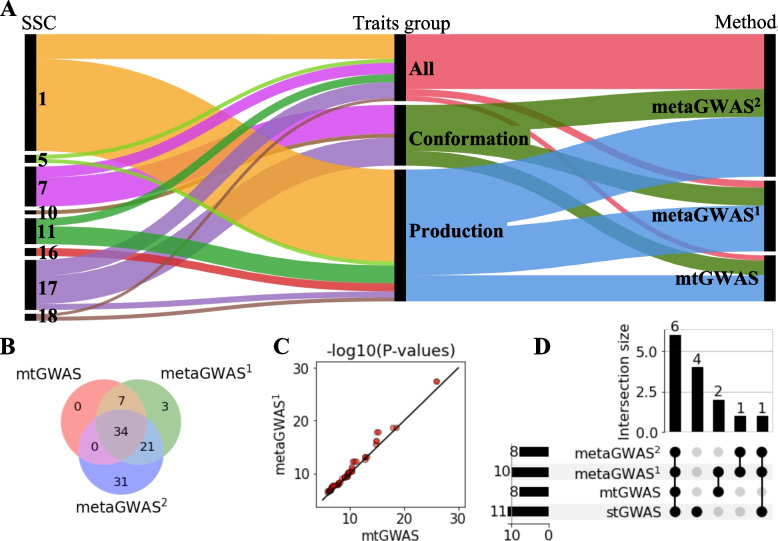
Fig. 1.
Comparison of variants associated with 24 traits from 3 multi-trait GWAS methods. Multivariate (mtGWAS), meta-analyses with complete dataset (metaGWAS1), and meta-analyses including samples with missing trait records (metaGWAS2) were based on array-derived genotypes. A Proportions of significantly associated variants discovered across chromosomes, groups of traits and multi-trait methods. B Overlaps between the associated variants revealed by each of the methods. Sum across all four trait-groups. C QQ plot between -log10(P) of variants (N = 41) associated in both mtGWAS and metaGWAS2. The line denotes a correlation of 1. D QTL detected by different methods across all trait groups

