Fig. 5.
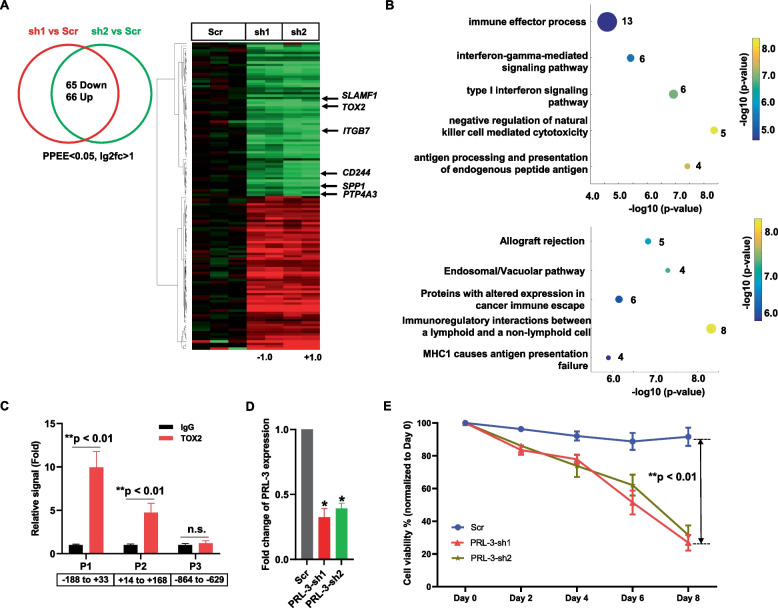
Genetic inhibition of TOX2 in NKTL cells. A Overlap analysis (left panel) and heatmap (right panel) of genes that were differentially expressed induced by knockdown of NKYS cells. Here, FDR of 0.1 was used as a cutoff. Significant gene expression changes are defined by DESeq2 algorithm with fold change ≥ 2 and adjusted p < 0.05. Selected 6 genes including TOX2 were highlighted on the heatmap. B Gene ontology enrichment analysis (upper panel) and pathway analysis (lower panel) of TOX2-regulated genes revealed by RNA-seq analysis. C TOX2 occupancy on TOX2 binding sites in the PRL-3 (PTP4A3) promoter was examined by ChIP using anti-TOX2 antibody with IgG as negative control. ChIP-qPCR was conducted using primers flanking TOX2 binding sites in PRL-3 promoters (P1 and P3). A region without TOX2 binding site (P3) was used as a control. The occupancy of TOX2 on these sites were calculated as percentage of the respective input DNA concentration and expressed as relative signal after normalized against the IgG samples (set as 1). Values are shown as mean ± SD of four independent experiments. **, significantly higher (p < 0.01) than the respective IgG samples. n.s., not significant. Negative and positive numbers indicate the regions relative to the TSS of PRL-3. D NKYS cells were transfected with scramble shRNA (Scr) or PRL-3-sh1, -sh2. Efficacy of PRL-3 silencing measured by qRT-PCR. Data were normalized to GAPDH level (internal control) for each sample and are expressed as the fold change relative to scramble control population (mean ± SD) *p < 0.05. E Cell viability was assessed by CTG assay every 2 days up to day 8. The percentage of cell viability of day 2, 4, 6, 8 was compared with day 0 as baseline (100%). Data shown are the average of 3 independent experiments and each experiment was done in triplicate. **p < 0.01, significant difference between Scr group and PRL-3-sh group

