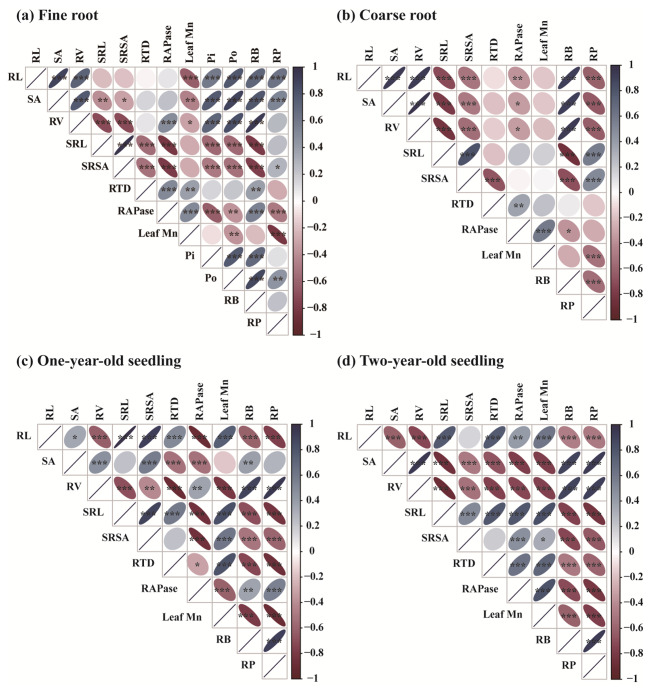
Fig. 6.
Correlations between root morphology traits, acid phosphatase activity, leaf Mn concentration, root biomass, and root P concentration (Note: Data from one- and two-year-old seedlings were used for both fine and coarse root analyses. Data for both one- and two-year-old seedlings were analyzed using both coarse and fine roots. A blue ellipse indicates a positive correlation, and a red ellipse indicates a negative correlation. The shape and color depth of the ellipse represent the absolute value of the correlation, and the flatter the ellipse and the darker the color, the greater the absolute value of the correlation. Asterisks denote significance levels (* P < 0.05, ** P < 0.01, *** P < 0.001). RL, root length (cm); SRL, specific root length (cm mg–1); SA, root surface area (cm2); SRSA, specific root surface area (cm2 mg–1); RV, root volume (cm3); RTD, root tissue density (mg cm–3); RB, root biomass (g plant–1); RAPase, root APase (µmol pNP g− 1 min− 1); RP, root phosphorus (g kg–1); Pi, soil inorganic P; and Po, soil organic P)

