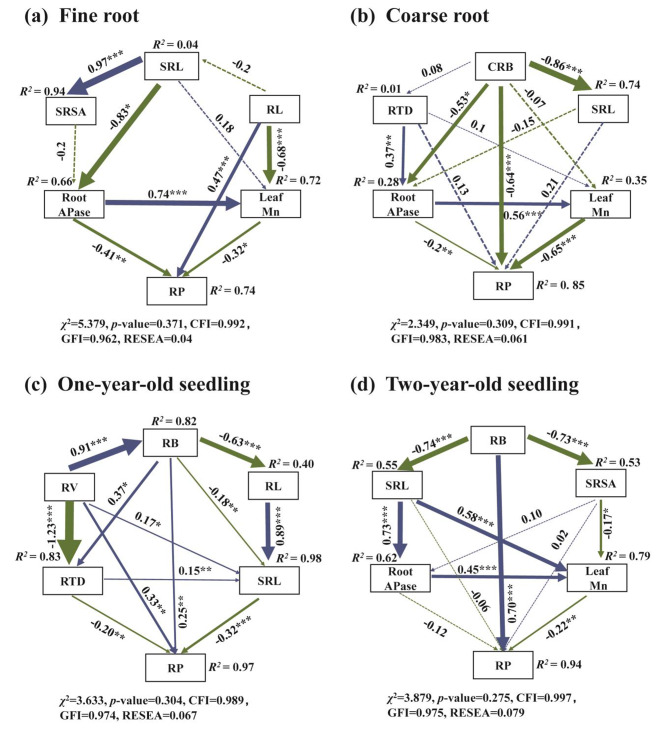
Fig. 7.
Structural equation models of root traits and root phosphorus concentration (Note: Blue lines indicate positive relationships, and green lines indicate negative relationships. Solid lines represent significant relationships and dashed lines represent non-significant relationships. Asterisks represent the level of significance: * not present, P > 0.05; otherwise * P < 0.05, ** P < 0.01, *** P < 0.001. Standardized regression coefficients for each path are given, and results for model fit tests are also reported underneath each figure. RP, root phosphorus (g kg–1); RL, root length (cm); SRL, specific root length (cm mg–1); SRSA, specific root surface area (cm2 mg–1); RTD, root tissue density (mg cm–3); CRB, coarse root biomass (g plant–1); RB, root biomass (g plant–1); RV, root volume (cm3); and RAPase, root APase (µmol pNP g− 1 min− 1))

