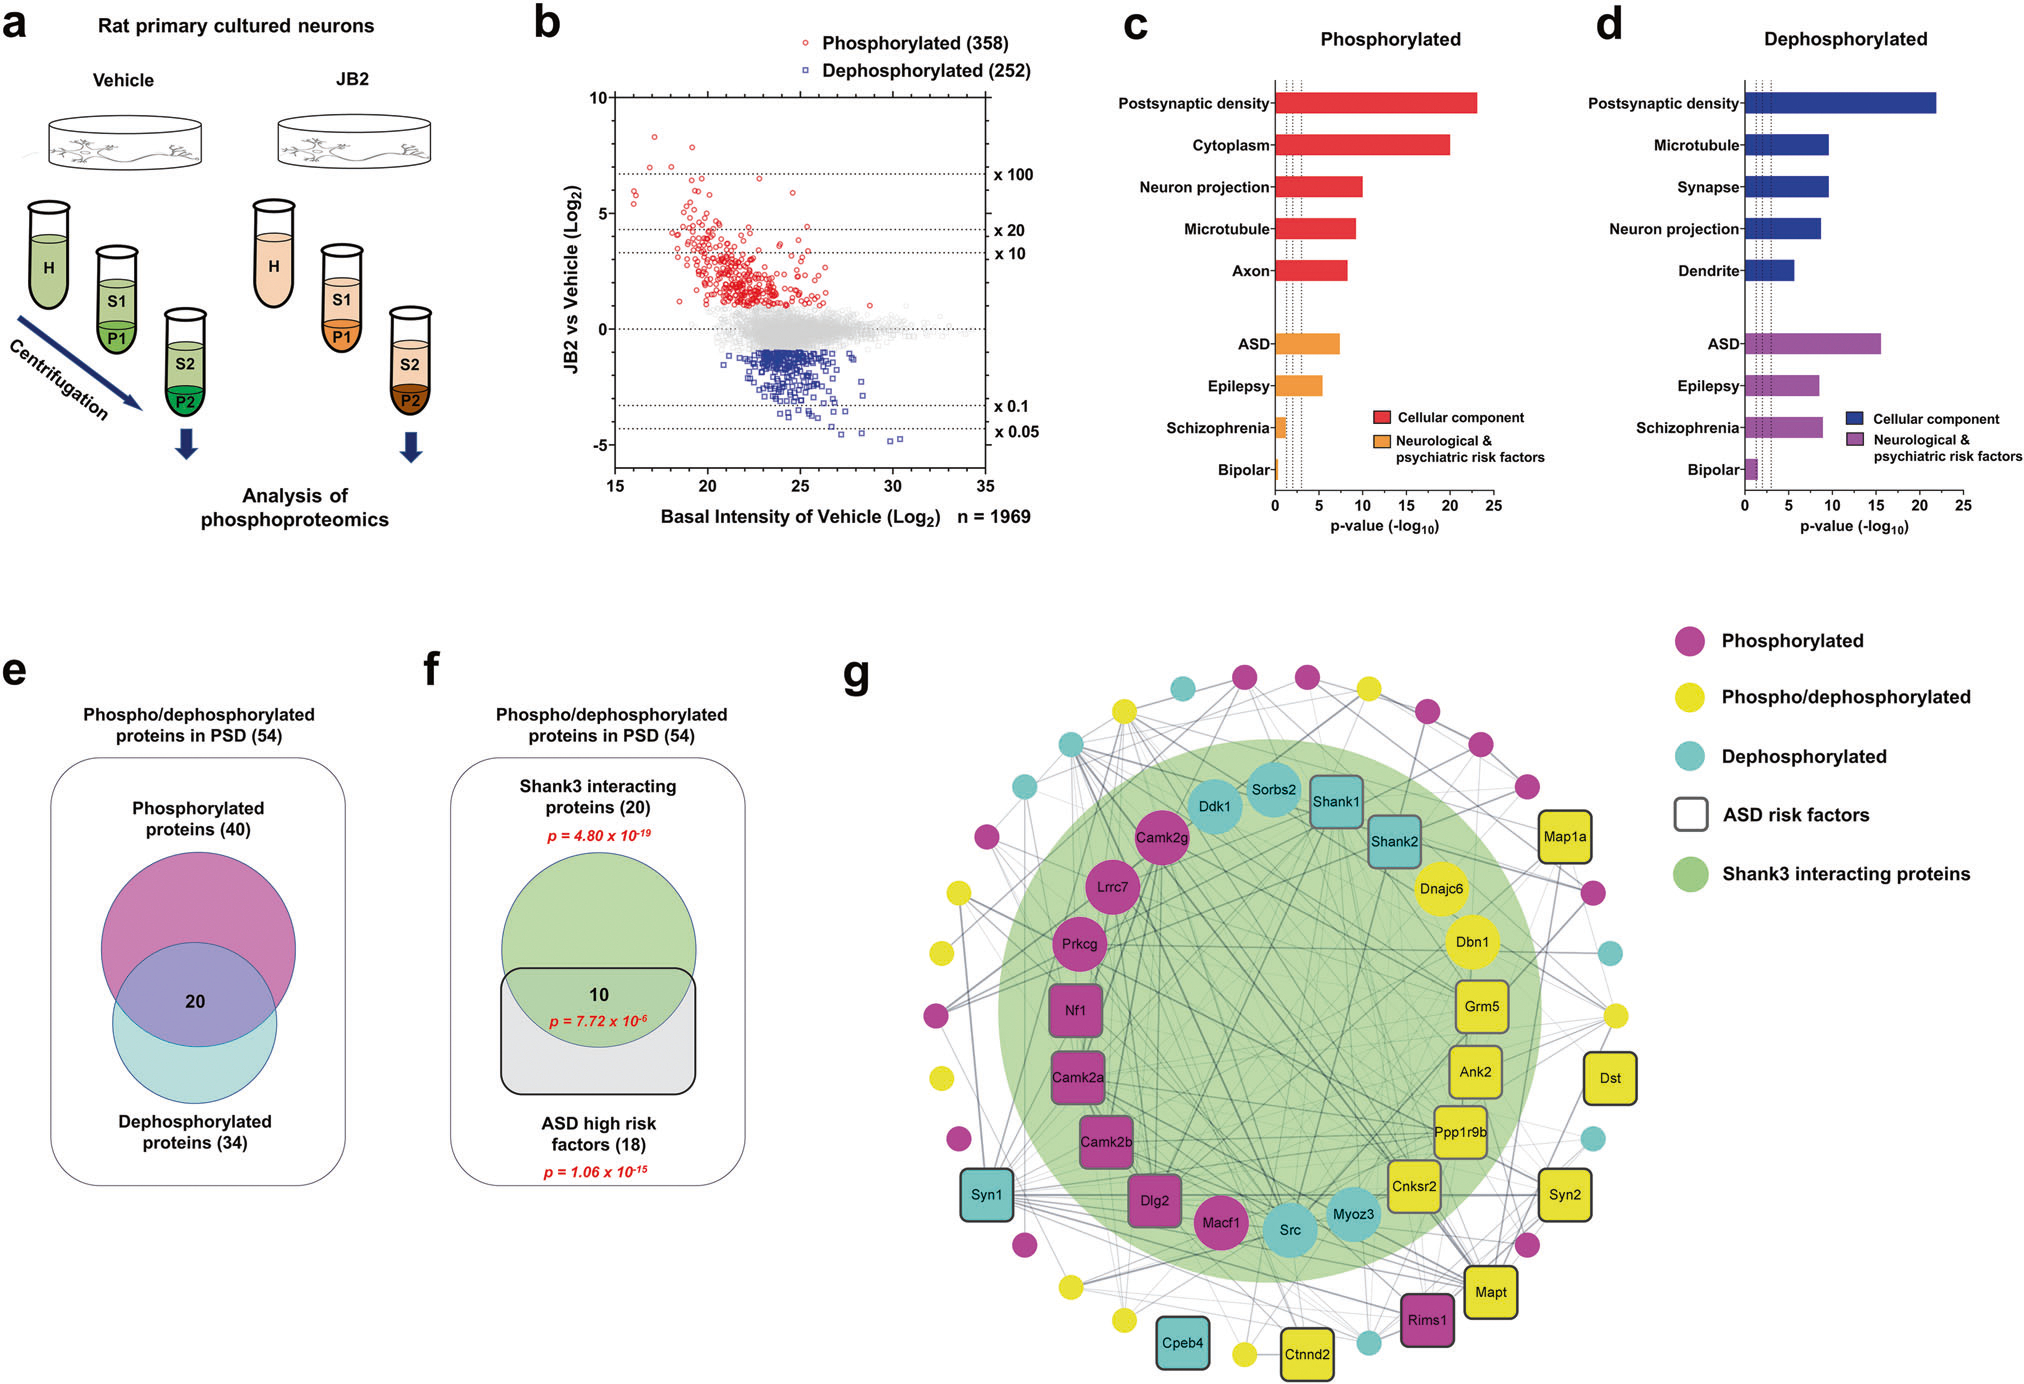
Fig. 2. JB2 regulates the phosphorylation of postsynaptic autism risk factors in primary cortical cultured rat neurons.

a Scheme of the experimental workflow of the phosphoproteomic analysis. b Scatter plot showing the fold change of individual phosphorylated or dephosphorylated protein levels, after JB2 treatment, and the vehicle. Phosphorylated proteins are in red (fold change ≥ 2), dephosphorylated proteins are in blue (fold change ≤0.5), and all other proteins are in gray (0.5 < fold change < 2). c, d Gene ontology (GO) analysis of statistically overrepresented biological processes among the differentially phosphorylated (in red) or dephosphorylated (in blue) proteins. The analysis was performed from data in b by DAVID. Enrichment of ASD, schizophrenia (SZ), epilepsy, and bipolar disorder (BD) risk factors (identified through SFARI gene archive, GWAS, and de novo studies) among phosphorylated (in orange) and dephosphorylated (in purple) proteins. Hypergeometry test. e Diagram showing the number of either phosphorylated or dephosphorylated proteins present in the postsynaptic density. f Diagram showing the number of either Shank3 interacting proteins or ASD high-risk factors (right panel). Significance (p-value) was demonstrated by hypergeometric tests. g Cytoscape analysis of PSD proteins with phosphor-/dephosphorylated proteins coded by color. Rounded rectangle nodes indicate ASD risk factors. Edges indicate predicted protein-protein interaction, including experimental data from the STRING database. The range of the big green circle indicates the Shank3 interacting proteins. See also supplementary Fig. 2–4.
