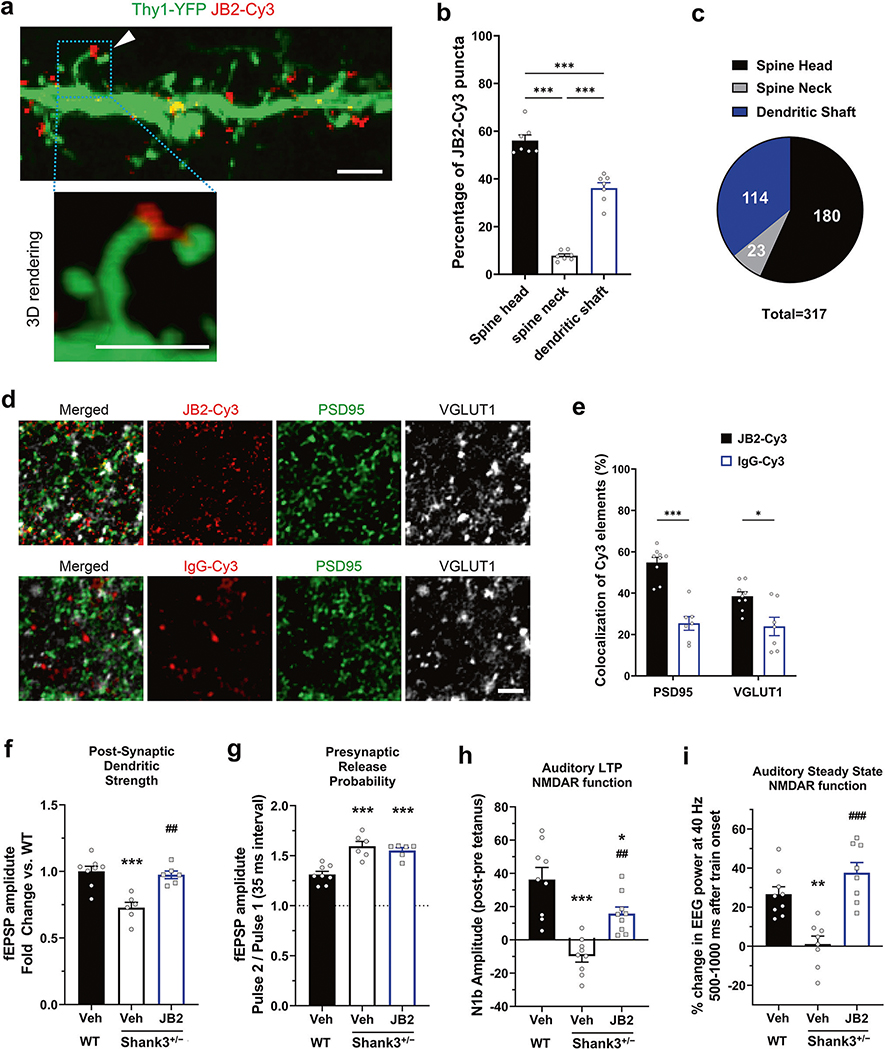
Fig. 3. JB2 rescues synaptic circuit impairments in adult male Shank3+/− mice.
a Representative confocal image of the JB2-Cy3 binding to the dendritic compartment of a layer 2/3 pyramidal neurons from a Thy1-YFP mouse fixed slice and 3D rendering of JB2 on a spine head. b, c Quantification of the percentage of JB2-Cy3 puncta on the dendritic localization of 7 neurons from 3 mice per each group, 2–3 neurons per animal. F(2, 18) = 157.0. d Representative images of the JB2-Cy3 and control IgG-Cy3 (Red) staining and the immunolabeling of PSD95 (Green) and VGLUT1 (Gray) in acute cortical slices acquired in the layer 2/3 of the somatosensory cortex. e Quantification shows significantly higher percentage of JB2-Cy3 colocalizing with synaptic markers compared to the control protein, each dot represents an individual slice (n = 7–9 slices per condition from 4 mice). F(1, 28) = 5.743. Two-way ANOVA, post-hoc Bonferroni test: ***p < 0.001, *p < 0.05. Scale bars: 2 microns f Single shock-induced field potential slopes, which primarily reflects post-synaptic AMPA receptor activity. F(2, 17) = 15.46. g Single shock induced field potential slopes, which primarily reflect presynaptic excitatory glutamate receptor activity. F(2, 17) = 18.43. h Auditory LTP impaired in Shank3+/− mice, suggesting impaired NMDAR function. F(2, 24) = 19.75. i 40 Hz Auditory steady-state response of EEG F (2, 22) = 17.67. One-way analysis of variance was followed by Bonferroni post hoc tests. *p < 0.05; **p < 0.01; ***p < 0.001 vs wild-type vehicle and ##p < 0.01; ###p < 0.001 vs Shank3+/− vehicle. All data are represented as mean ± SEM. See also supplementary Fig. 5.

