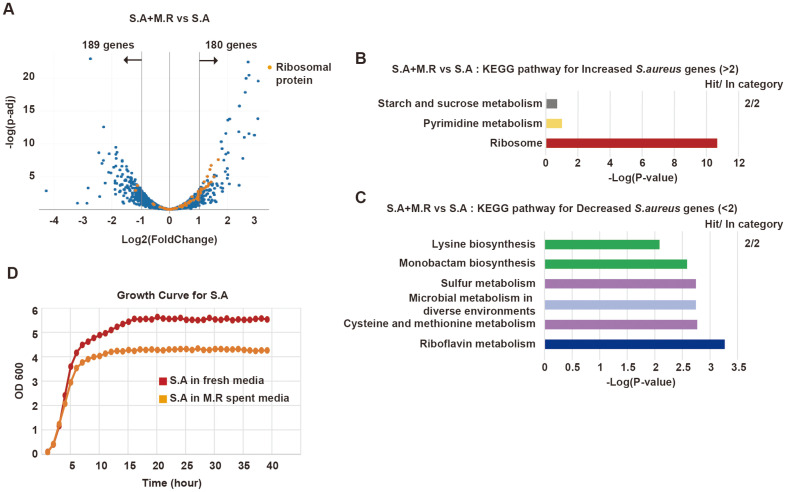
Fig. 6. Transcriptional changes in S. aureus upon co-culturing with M. restricta.
A. Volcano plot showing transcriptional changes in S. aureus co-cultured with M. restricta compared to S. aureus axenic culture (S.A+M.R vs S.A). B. KEGG pathway groups for S. aureus genes exhibiting more than 2-fold increase (S.A+M.R vs S.A). C. KEGG pathway groups for S. aureus genes exhibiting more than 2-fold decrease (S.A+M.R vs S.A). D. Growth curve of S. aureus in fresh or M. restricta spent media.

