Figure 4.

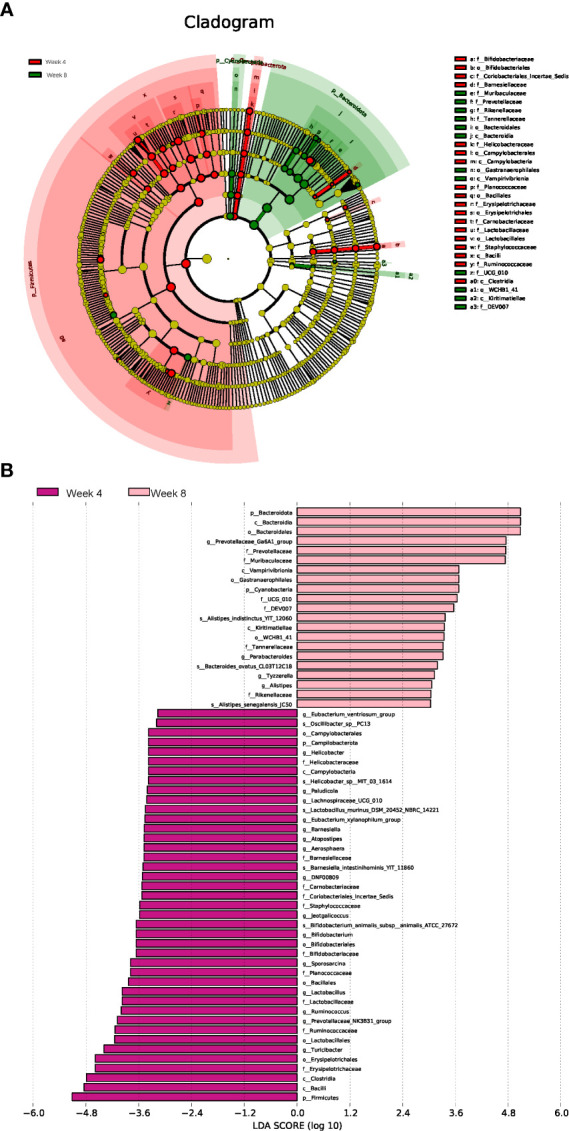
Linear discriminant analysis effect size (LEfSe) analysis. Cladogram (A) and histogram (B) illustrating the species responsible for discriminating the rats under 4 weeks of CUMS and 8 weeks of CUMS (n = 10 per group).

Linear discriminant analysis effect size (LEfSe) analysis. Cladogram (A) and histogram (B) illustrating the species responsible for discriminating the rats under 4 weeks of CUMS and 8 weeks of CUMS (n = 10 per group).