Figure 6.
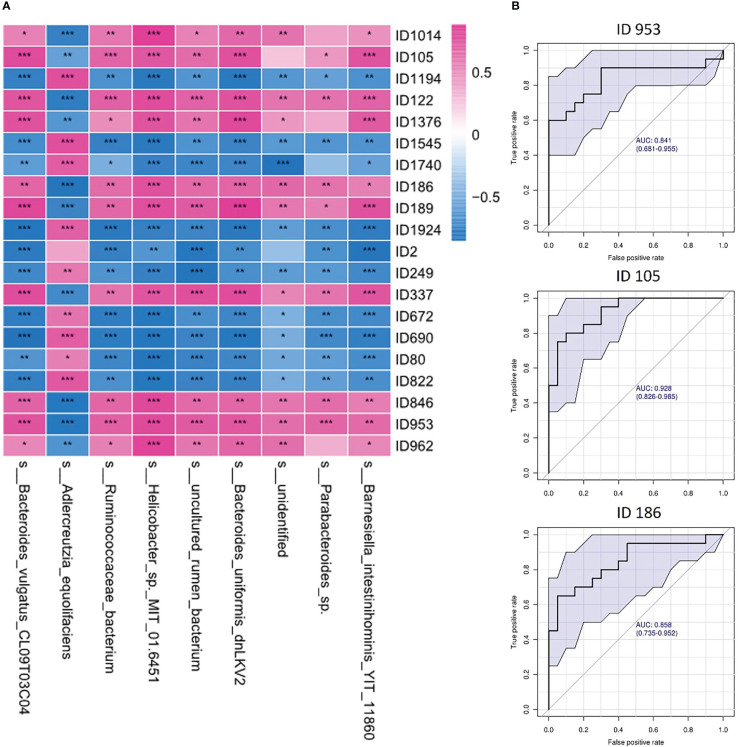
Correlations between gut microbes and fecal metabolites. (A) Heatmap of correlations between gut microbes and fecal metabolites in depression rats; (B) ROC curve of the top 3 representative metabolites related to gut microbes (ID953: N-acetyl-d-glucosamine; ID105: 3-(3-Hydroxyphenyl)propanoic acid; ID186: N-acetyl-d-mannosamine). One asterisk (*) represents a p-value less than 0.05, two asterisks (**) represent a p-value less than 0.01, and three asterisks (***) represent a p-value less than 0.001.

