
Figure 1: Increased power enables CLL driver gene detection.
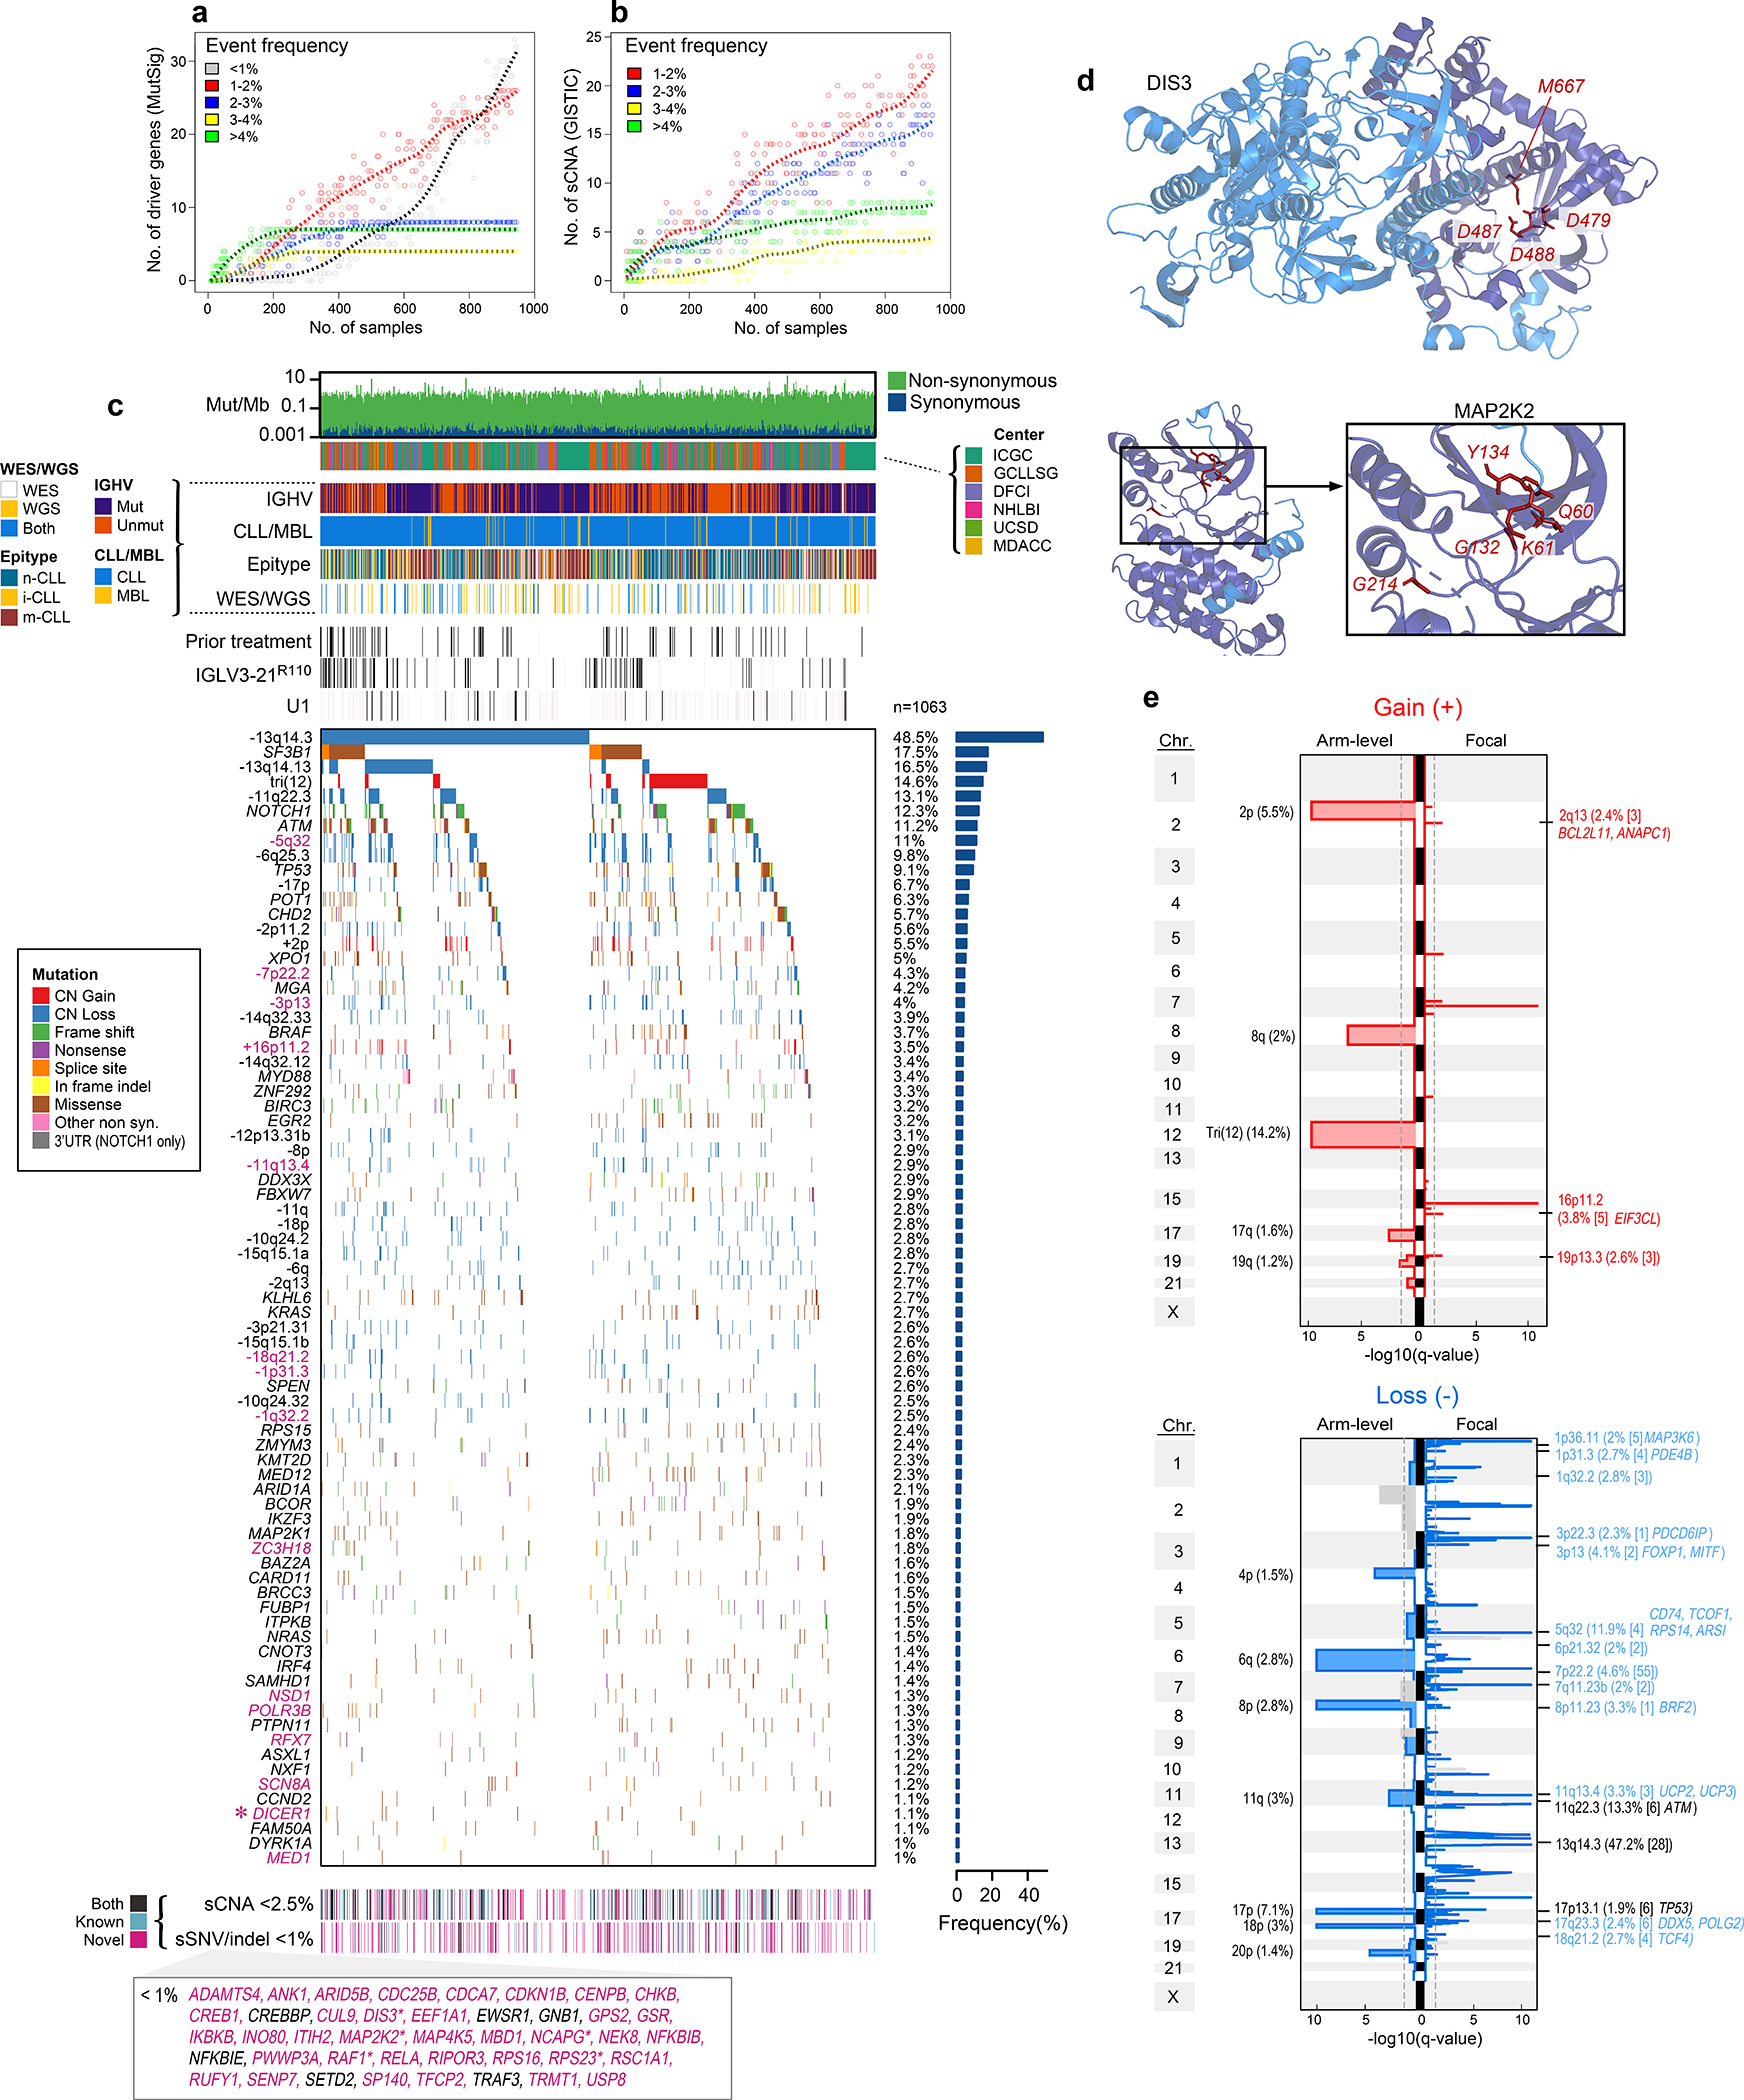
a-b. By down-sampling analysis, driver gene (a) and sCNA (b) discovery increases with additional samples. Points represent a random subset of samples with smoothed fit line; analysis separated by frequency.
c. Landscape of genetic alterations in CLL with frequency of alterations (right, n=1063 patients). Header tracks - annotation of cohort, IGHV status, CLL or MBL sample, epigenetic subtype (epitype: naive-like, n-CLL; intermediate, i-CLL; memory-like, m-CLL), sequencing data type; prior treatment, U1 and IGLV3–21R110 mutations - black; magenta label - novel alterations. Asterisks - discovery by CLUMPS. Bottom tracks - Lower frequency sSNV/indels and sCNAs, designated as novel (magenta), known events (blue) or both (black). Bottom boxed inset - candidate driver genes, frequency <1%.
d. Representative genes identified by CLUMPS (see Supplementary Table 5). 3D protein structure of MAP2K2 and DIS3. Mutated residues (red labels) cluster in functional regions (purple).
e. Recurrent copy number gains (top) and losses (bottom) by GISTIC analysis showing arm level (left) and focal events (right). Chromosome number - vertical axis; dashed line - significance, q=0.1. Blacklisted regions - gray. Arm level events are labeled with cytoband and frequency (n=984). Focal events denote cytoband, frequency, number of genes encompassed in peak (bracketed), and genes of interest. Red/blue font: novel focal events with frequency >2%. Black font: previously known events (see Supplementary Table 7).