
ED Fig 6. Mutational mechanisms and cancer cell fractions of candidate drivers.
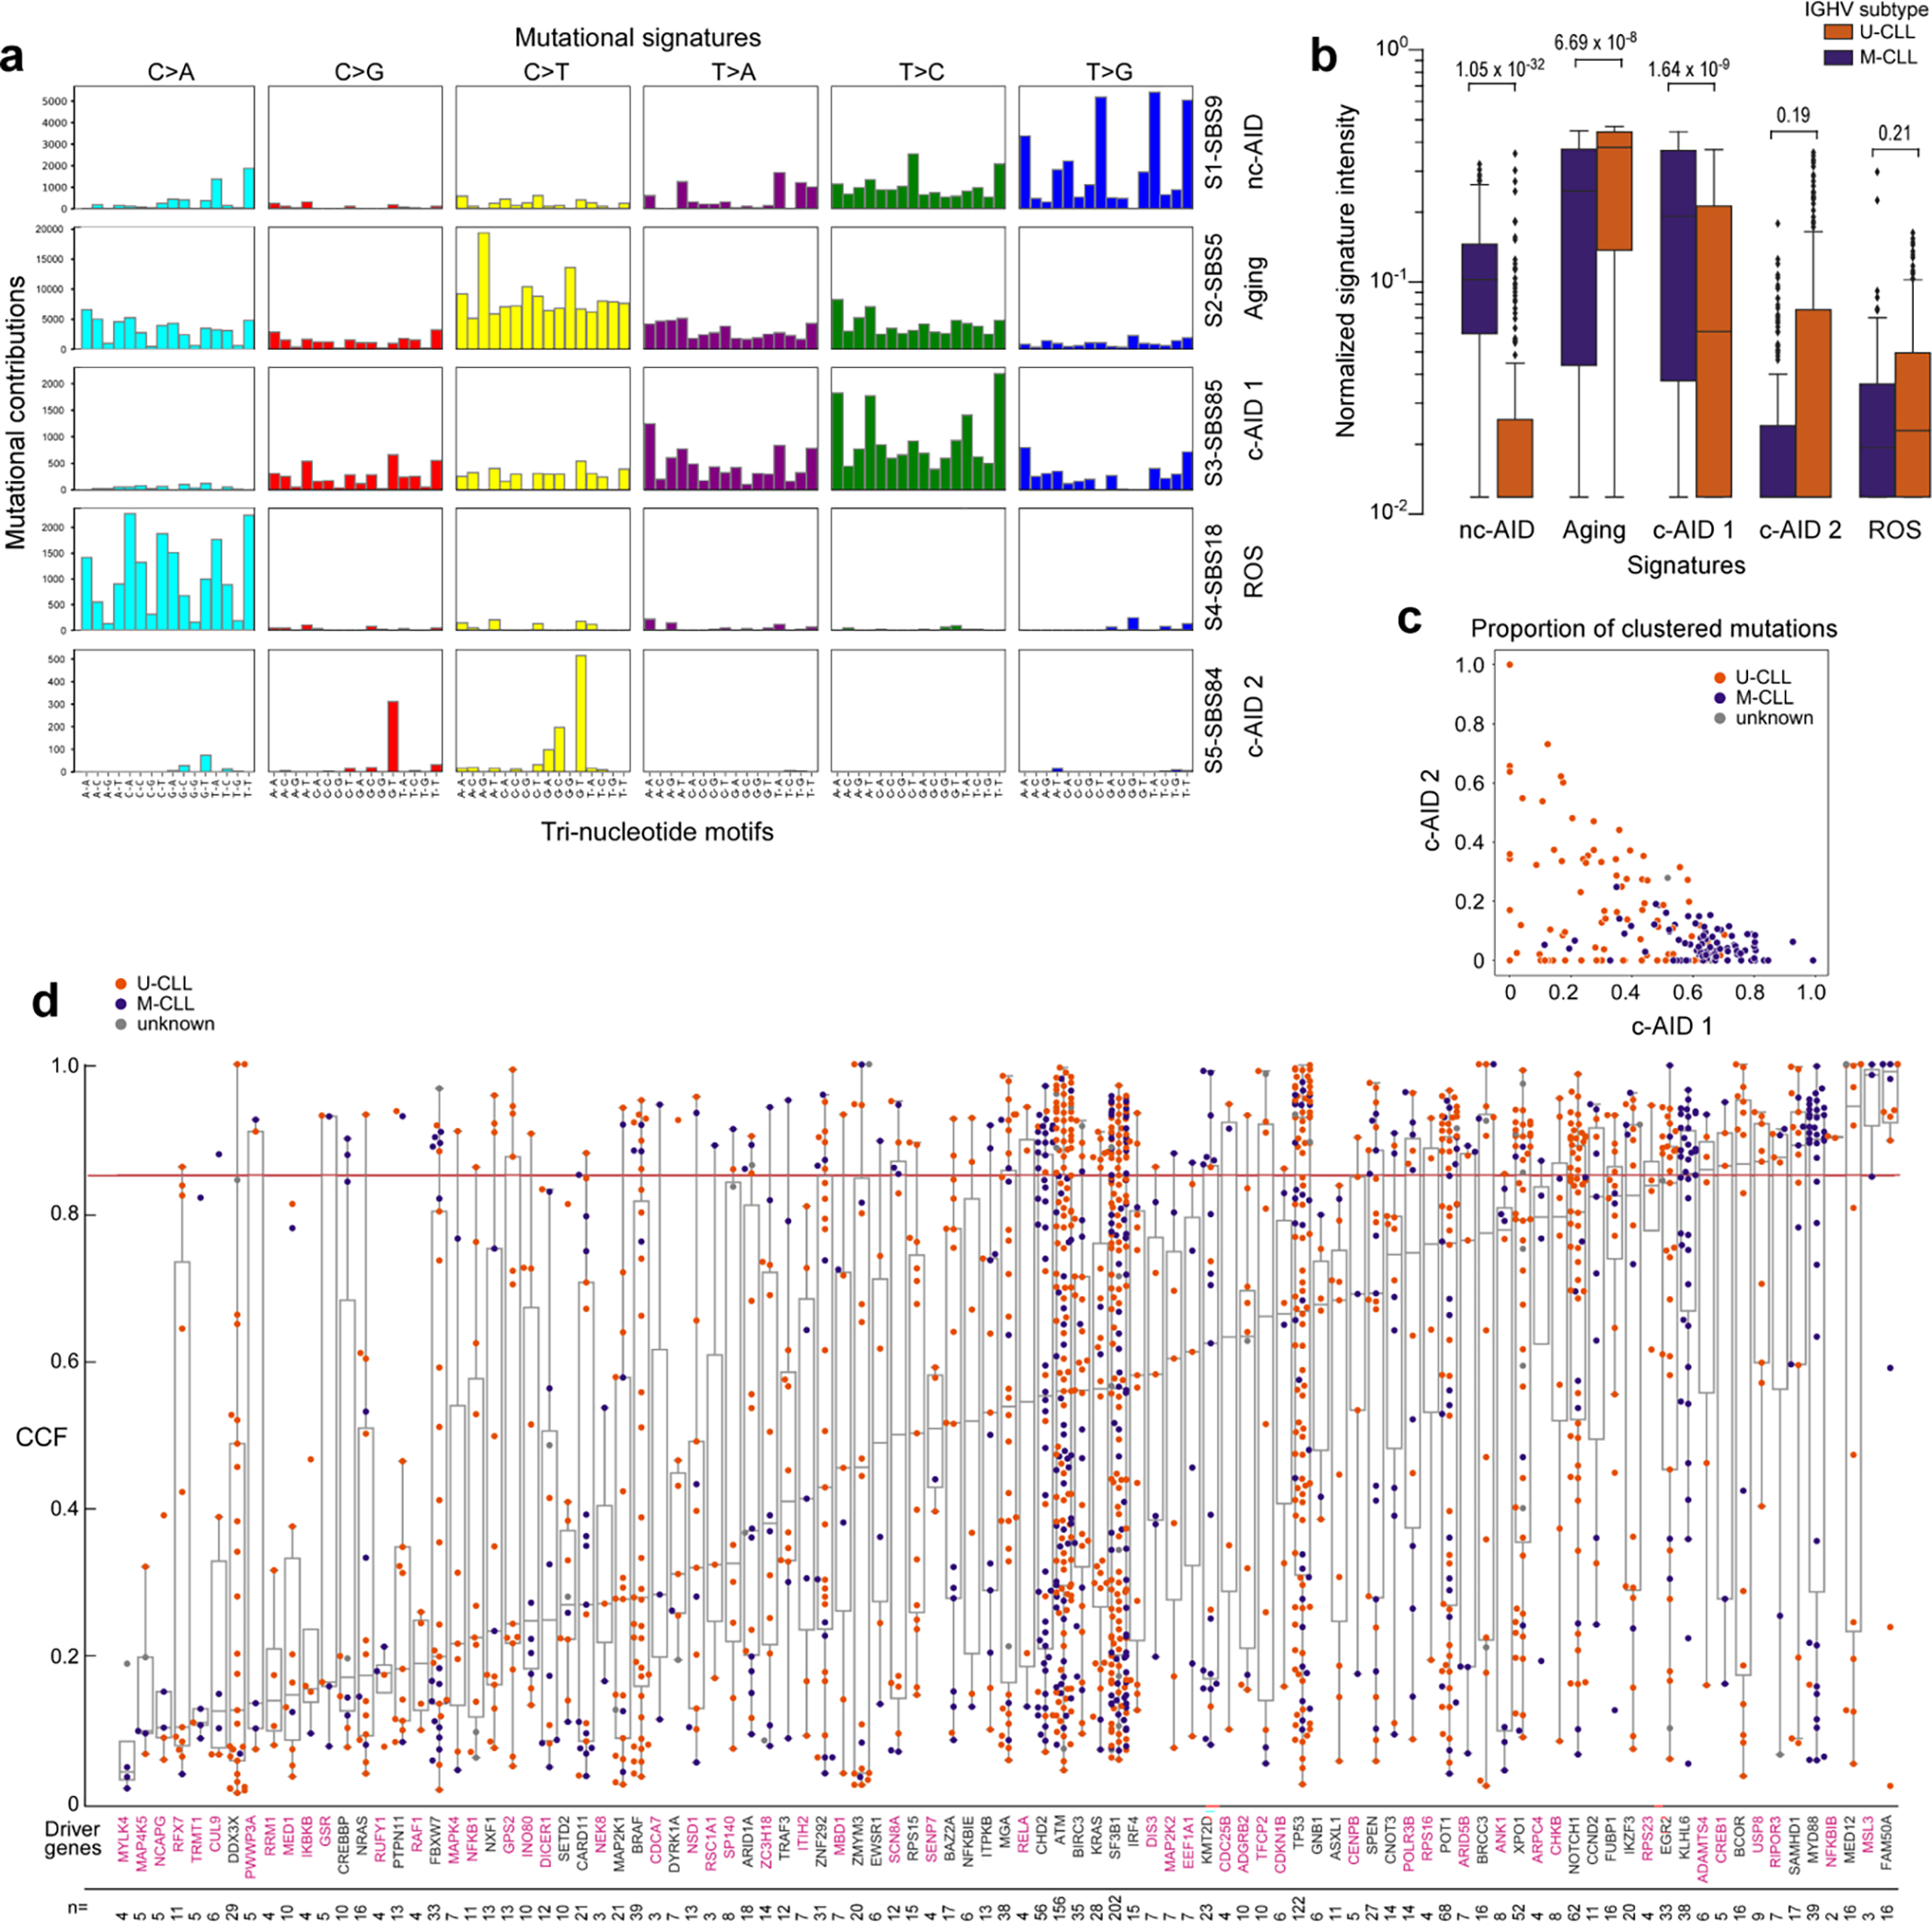
Eight mutational signatures were identified in 177 WGS, but 3 signatures corresponded to known artifacts and were therefore excluded (see Supplementary Note 2). Boxplots demonstrating mutation contribution for each of the 5 signatures are labeled with single-base substitution (SBS) number and identity (per COSMIC v3.1). b. Comparison of the normalized signature intensity of the mutational signatures in U-CLL (orange, n=87) vs. M-CLL (purple, n=88). The nc-AID and c-AID 1 signatures were enriched in M-CLL, whereas the aging signature was more prevalent in U-CLL. Although not significant, there was a trend of increased mutations due to the c-AID 2 signature in U-CLL. All p-values were calculated with Wilcoxon rank-sum test, two-sided. Boxplots: center line, median; box limits, upper and lower quartiles; whiskers, 1.5x interquartile range; points, outliers. c. Proportions of clustered mutations contributed by the two c-AID related signatures (SBS84, c-AID 1 vs. SBS85, c-AID 2) for each IGHV subtype (M-CLL, purple; U-CLL, orange) d. Mean cancer cell fraction (CCF) for each non-silent mutation across all candidate driver genes identified in WES samples (n=984). Color of dots depicts the IGHV subtype (M-CLL, purple; U-CLL, orange). The horizontal red line is the threshold for clonality (CCF>85%). Magenta labels - newly identified putative driver genes. The number of non-silent mutations per driver gene is shown at the bottom. Boxplots: center line, median; box limits, upper and lower quartiles; whiskers, 1.5x interquartile range.