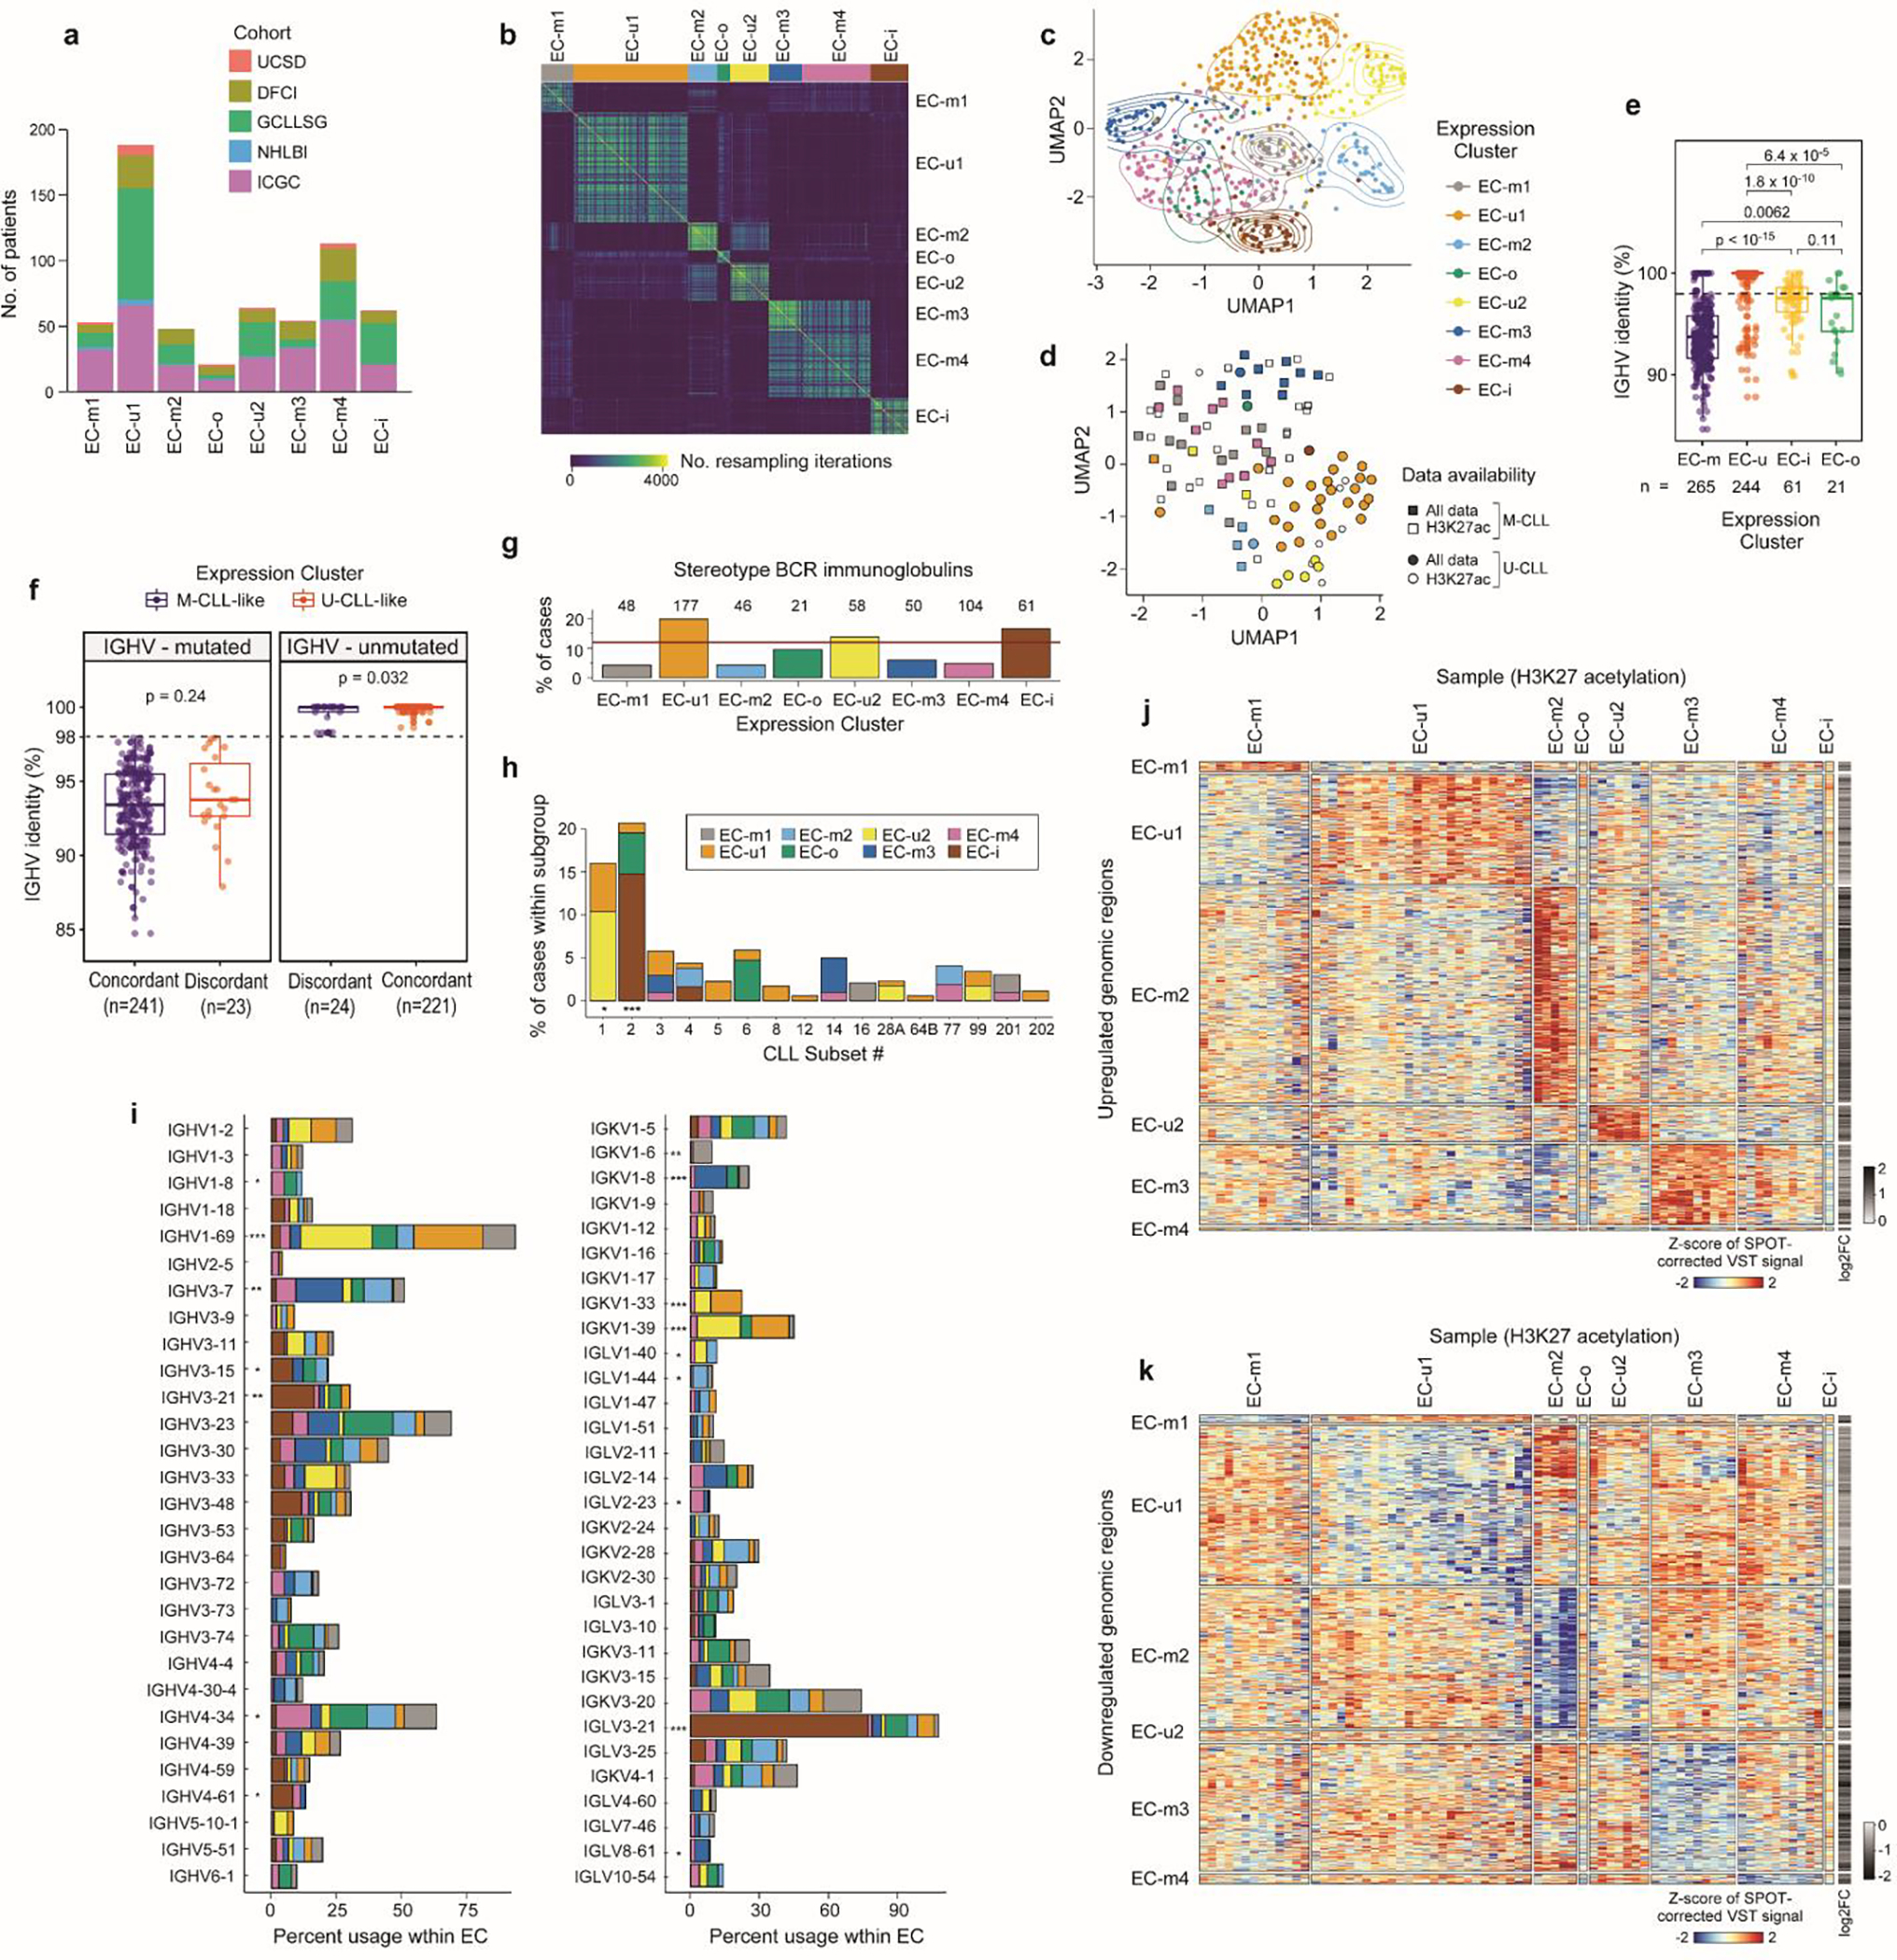
ED Fig 8. Identification of expression clusters with associated biologic features.

a. Cohort representation in each expression cluster. b. Consensus matrix for RNA expression profiles of 603 treatment-naive CLLs by repeated hierarchical clustering with 80% resampling and varying cutoffs for number of clusters, which is inputted to the BayesNMF procedure (Methods). c. Uniform manifold approximation and projection (UMAP) showing clustering of ECs (n=603; EC-u clusters (top), EC-m and EC-o (middle), EC-i (bottom)). Analysis was performed using the marker genes identified by BayesNMF. d. UMAP of H3K27ac profiles (n=104)8 denoting EC designation where available (colored points, n=73) and IGHV status. e. Comparison of the percent IGHV identity among ECs. Dotted line: 98% threshold defining M-CLL and U-CLL. P-values by two-sided t-tests. Boxplots: center line, median; box limits, upper and lower quartiles; whiskers, 1.5x interquartile range. f. Comparison of the percent IGHV identity between those samples with concordant IGHV status and ECs (e.g., M-CLLs in EC-m clusters) versus the discordant samples (e.g., M-CLLs in EC-u clusters). IGHV mutated cases - left; IGHV unmutated samples - right. P-values by two-sided t-tests. Boxplots: center line, median; box limits, upper and lower quartiles; whiskers, 1.5x interquartile range. g. Percentage of cases carrying stereotyped immunoglobulin genes within each EC. Red horizontal line: percentage of stereotyped cases in the whole cohort. h. Fraction of cases classified in each CLL stereotype subset according to their EC. i. Percentage of IGHV (left) and IG(K/L)V (right) gene usage within each EC. IGKV genes from proximal and distal clusters were merged for simplification. All p-values were calculated using Chi-squared tests corrected by the Benjamini-Hochberg procedure (q-values, q). q < 0.1; *, q < 0.05; **, q < 0.001; ***, q < 0.0001. j-k. Heatmaps showing upregulated (j) and downregulated (k) H3K27ac levels of EC marker genes and 2,000 bp upstream to capture regulatory regions (Methods).
