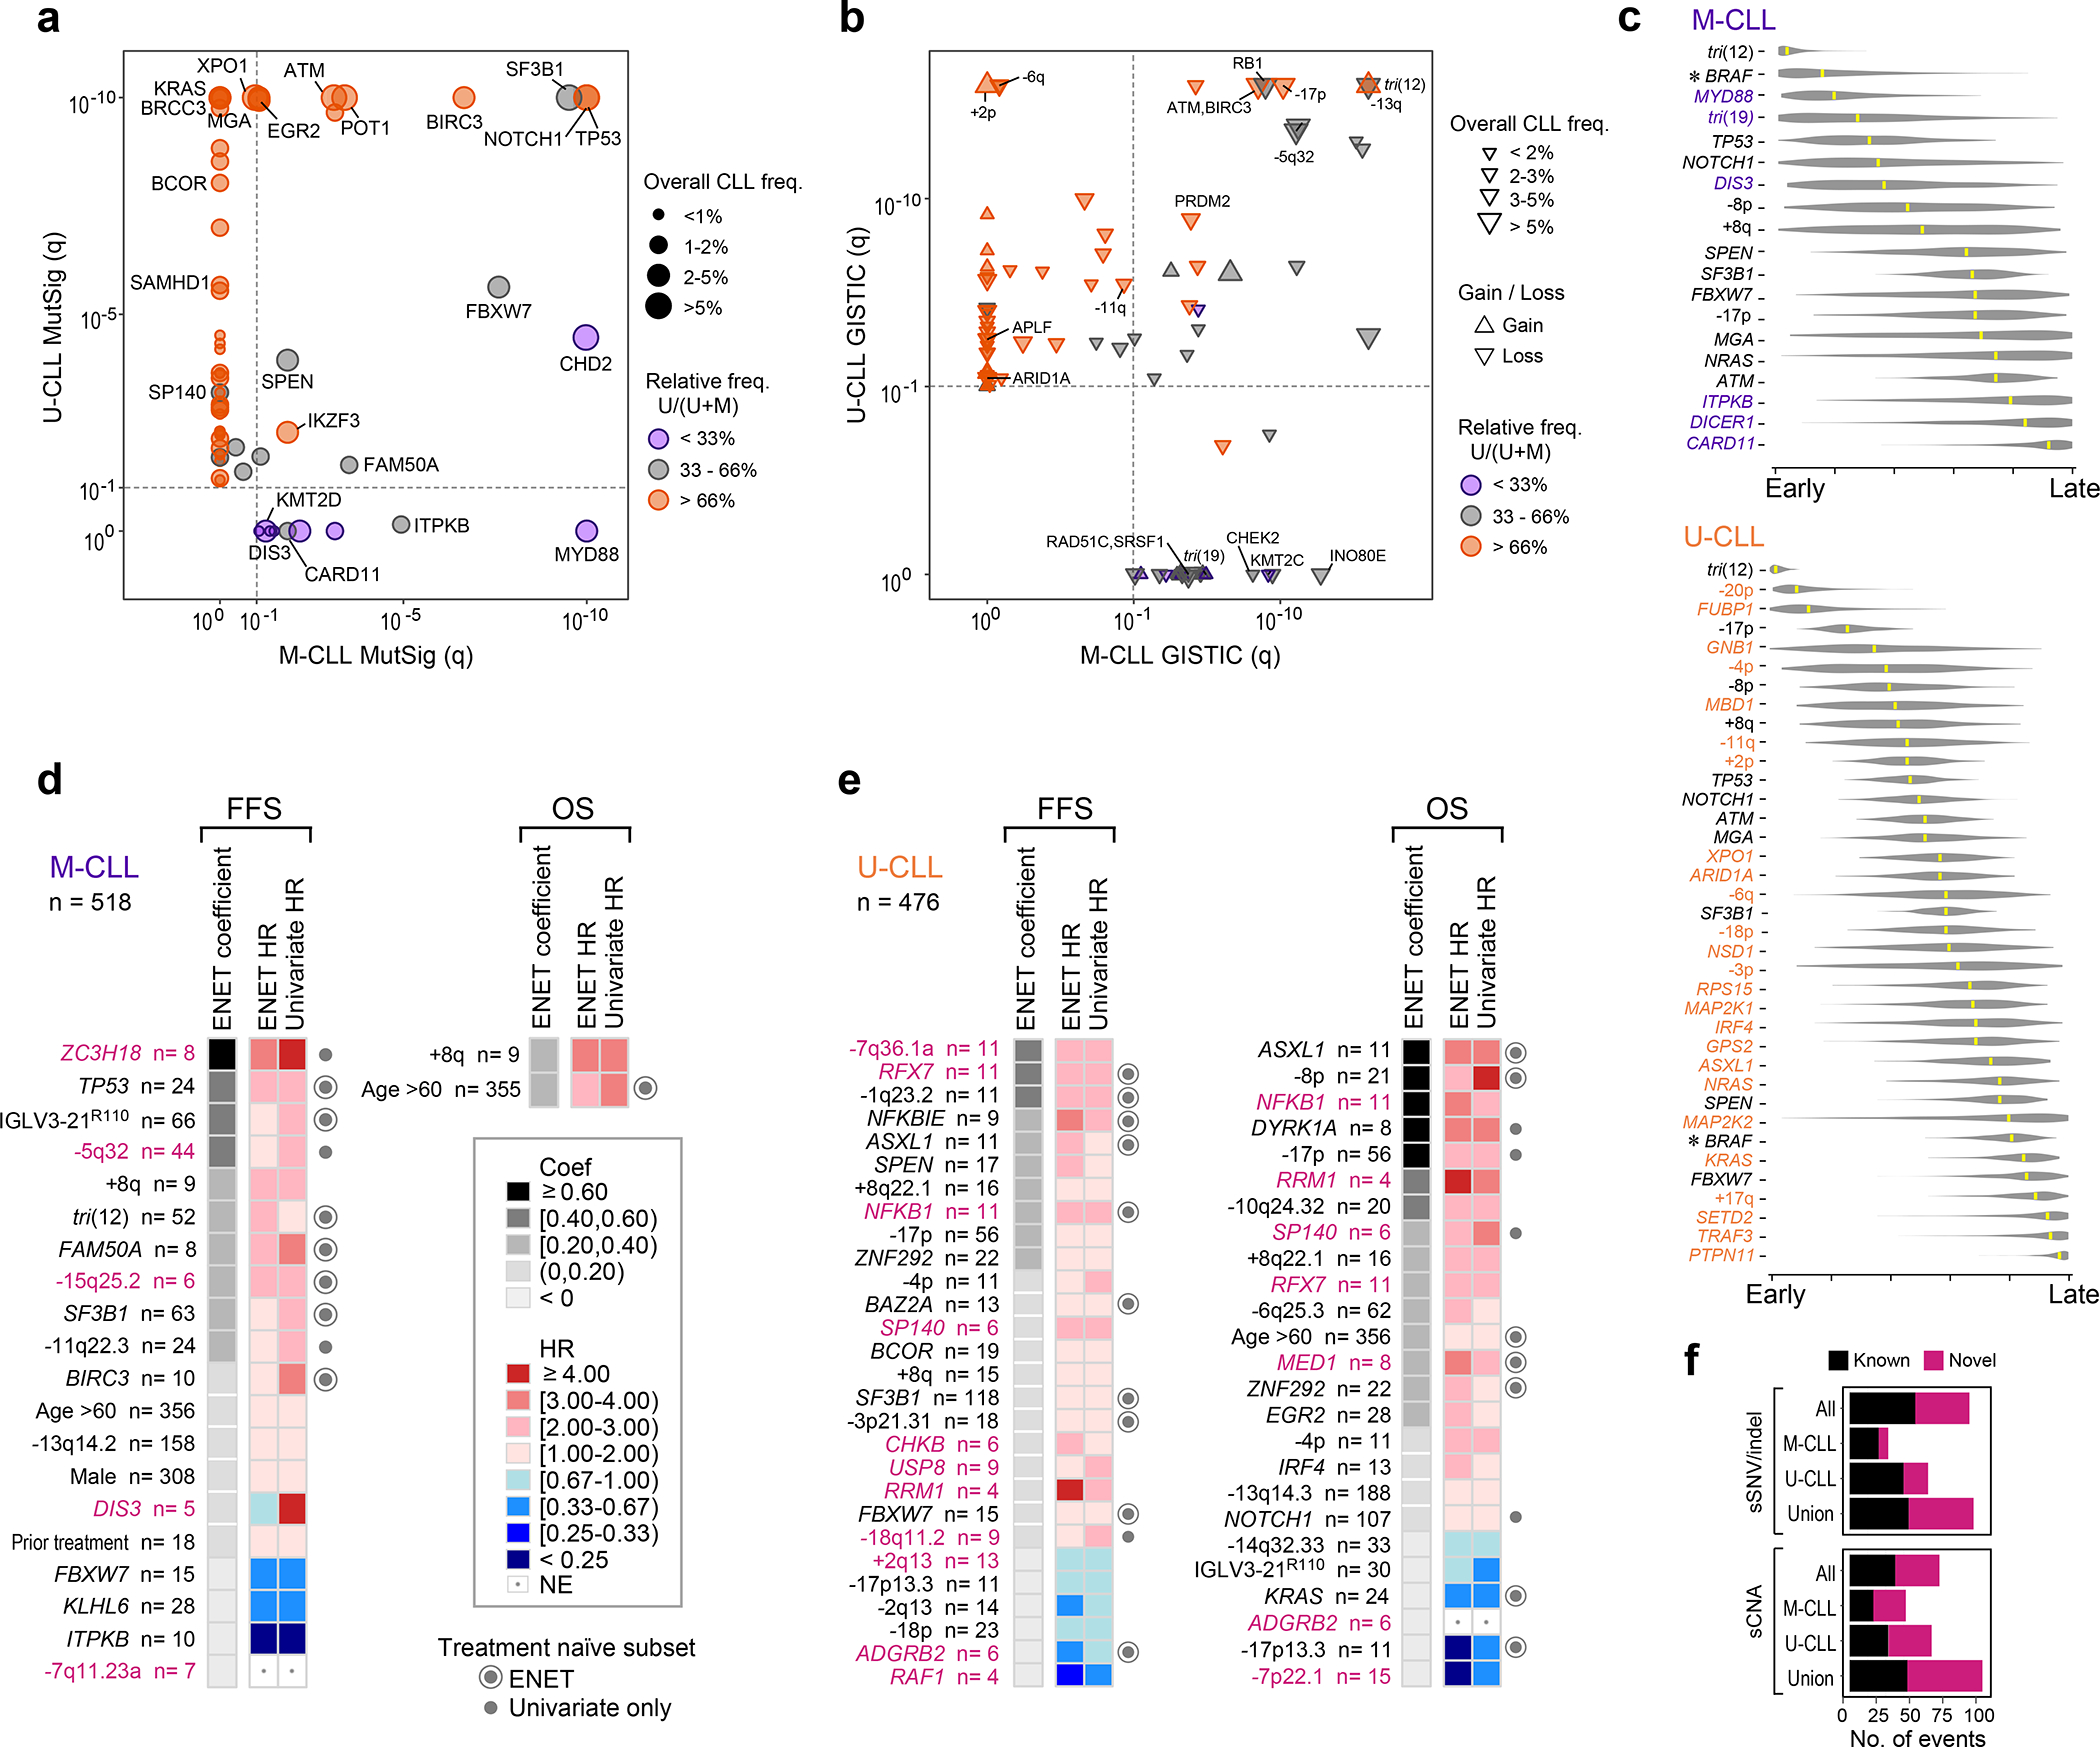
Figure 2: M-CLL and U-CLL have unique genomic landscapes.

a-b. Comparison of candidate driver genes (a) or copy number gains/losses (up/down triangle, respectively, b) in U-CLL (y-axis, WES, n=459) vs. M-CLL (x-axis, WES, n=512) plotted by −log10(q-value). Significance - dashed line. Representative candidate drivers are annotated. Frequency in entire cohort (n=984) - size of circle (a) or triangle (b). Orange - drivers predominantly in U-CLL; purple - predominantly in M-CLL.
c. League model timing diagrams comparing acquisition of somatic mutation and arm level sCNAs in M-CLL (top, n=251) and U-CLL (bottom, n=354). Higher timing score (x-axis) denotes later event; median scores - yellow marks (95% confidence interval, gray). Purple - events significant in M-CLL; orange - events significant in U-CLL; black - events shared by M-CLL and U-CLL. Asterisks - significant difference in timing (q<0.1).
d-e. Somatic alterations associated with failure free survival (FFS) and overall survival (OS) in M-CLL (d, WES/WGS, n=518 and U-CLL (e, WES/WGS, n=476). Events ranked by elastic net (ENET) coefficients, which identifies variables to be included in the model, shrinking coefficients to 0 when excluded. Heatmap denotes hazard ratios (HR) for ENET and univariate Cox regressions. Events included by ENET model (concentric circle) or significant in univariate analysis only (closed circle) in treatment-naive, non-trial patients (M-CLL, n=393; U-CLL, n=247) annotated on right. Magenta label - novel alterations (see Supplementary Table 11).
f. Number of candidate drivers in three genomic driver detection analyses: entire cohort (All, n=984), M-CLL (n=512) and U-CLL (n=459). For each analysis set, sSNV/indel represents candidate driver genes from MutSig2CV and CLUMPS, while sCNA represents recurrent events from GISTIC. Union - total putative drivers identified in any of the three analysis sets.
