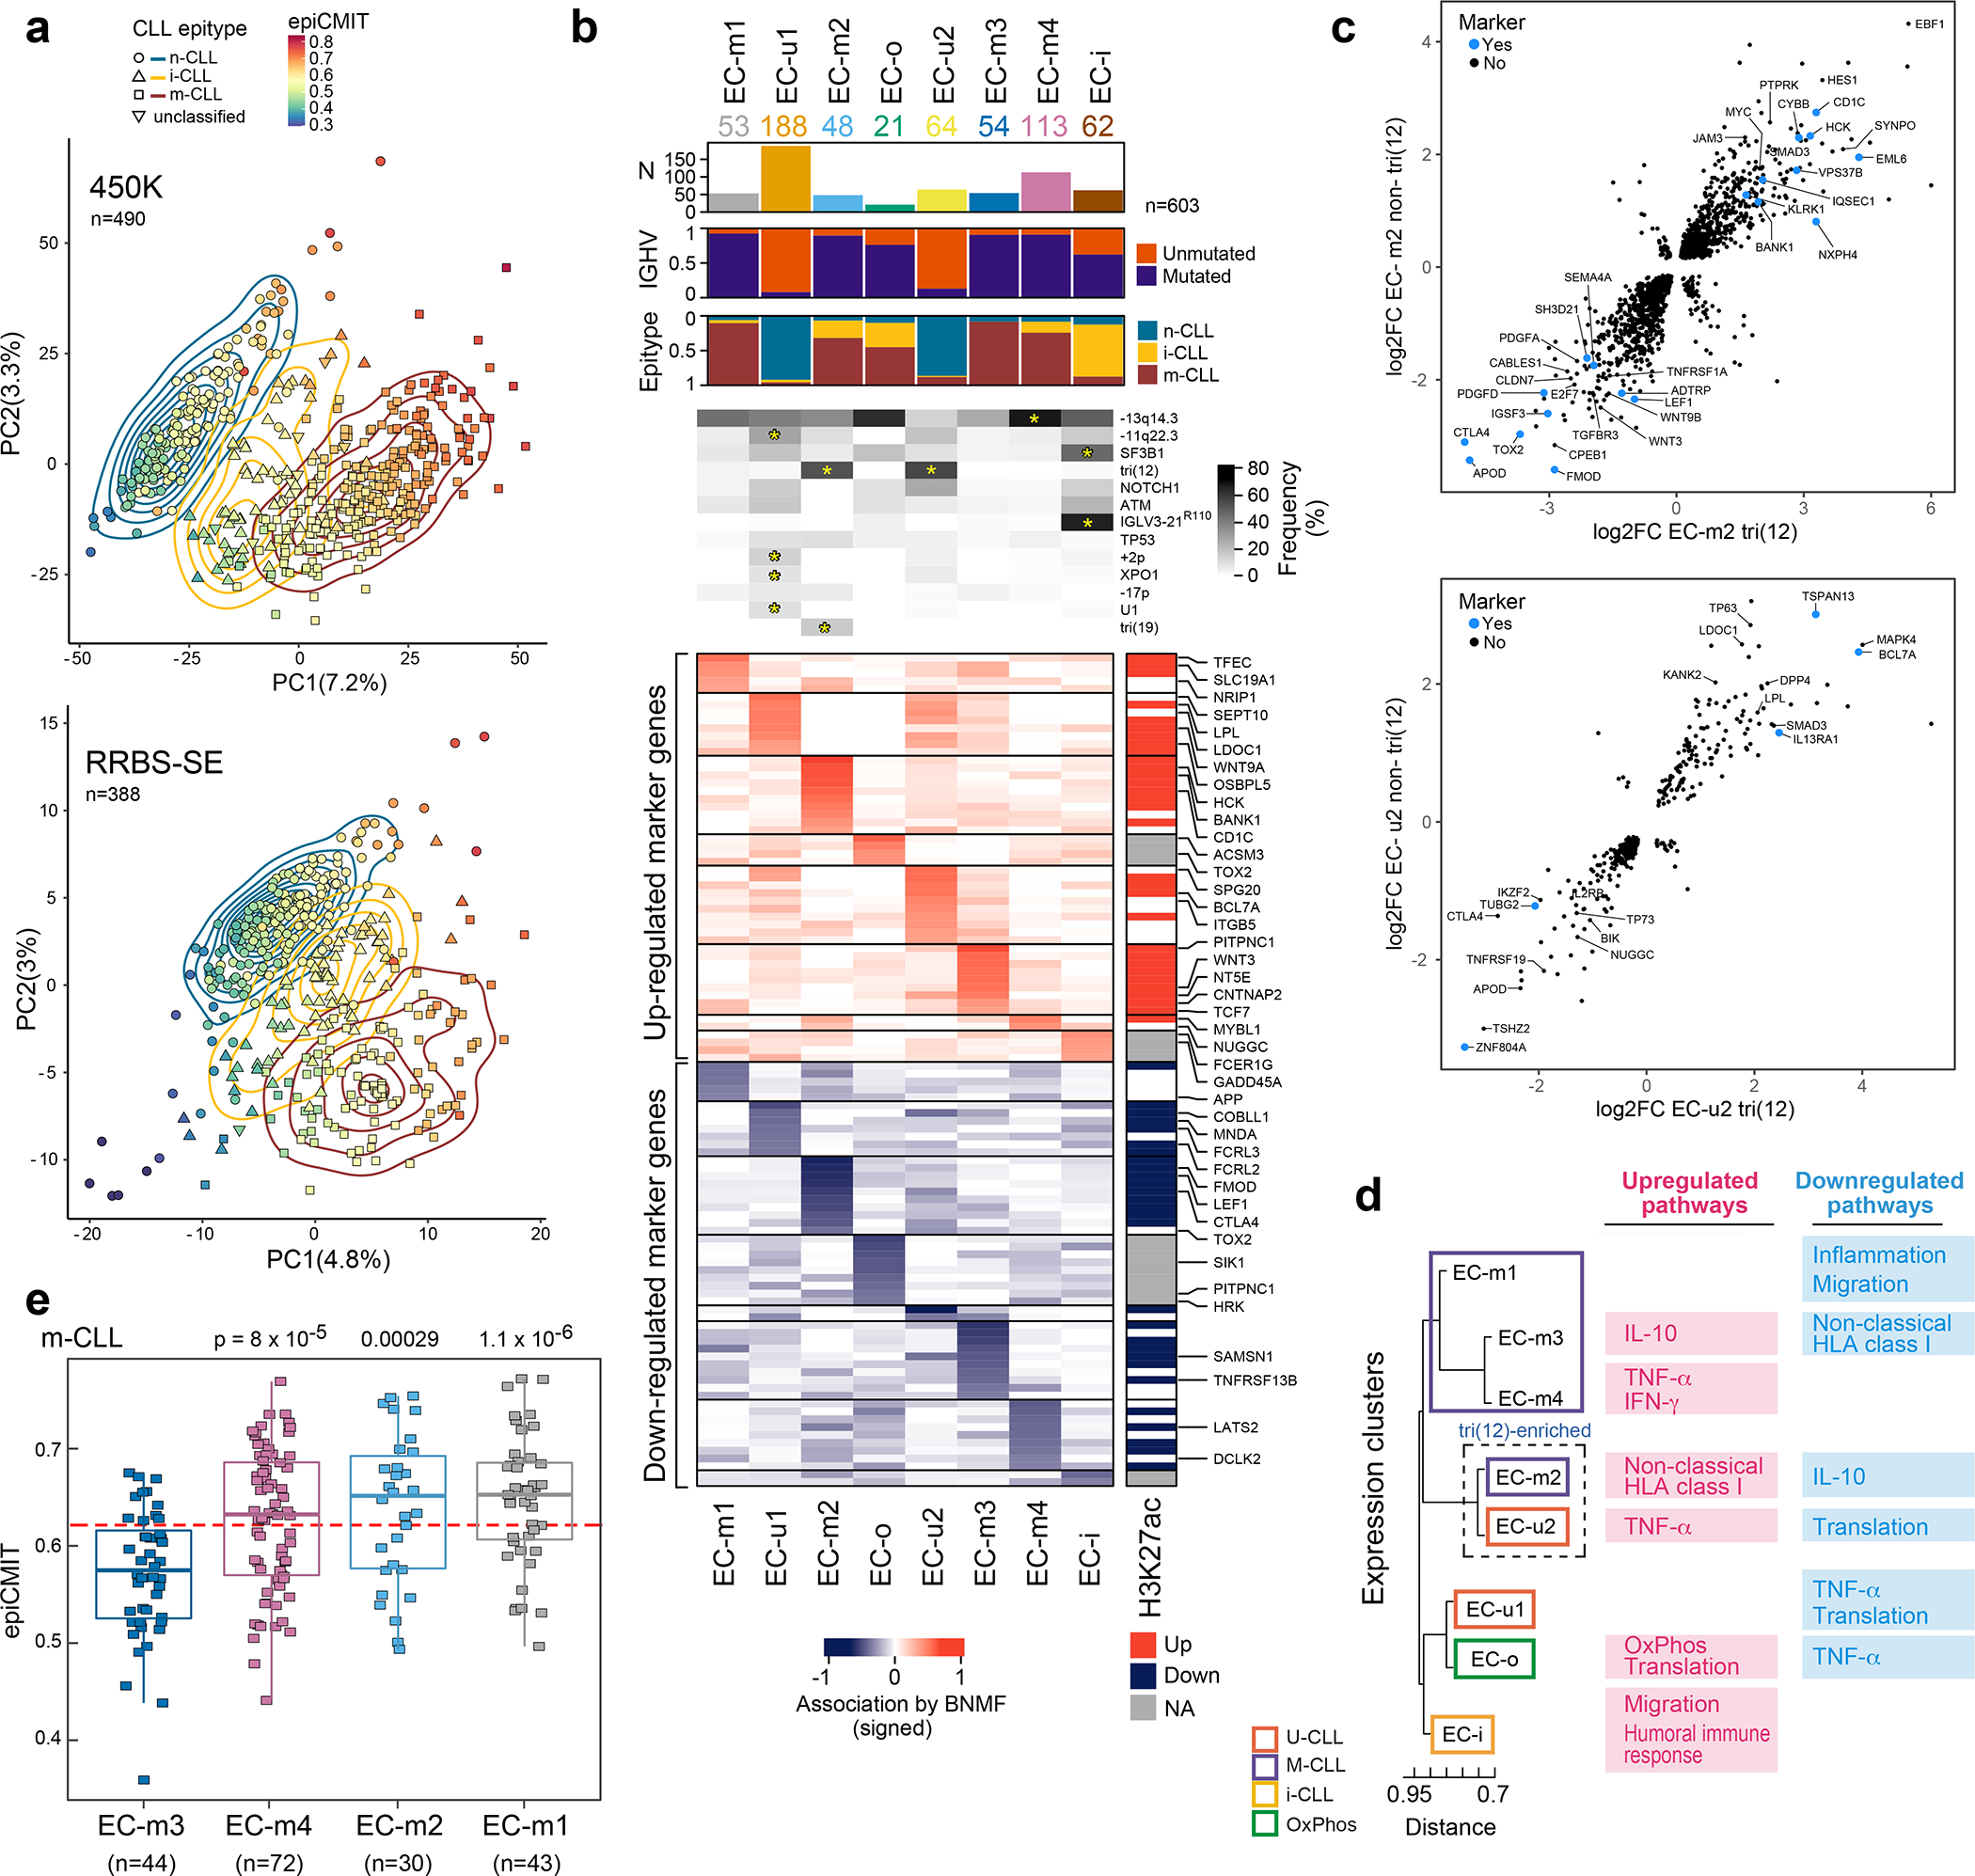
Figure 3: CLL subtypes based on epigenetic and transcriptomic features.

a. Main sources of variability in the DNA methylome are epitype and epiCMIT as determined by unsupervised principal component analysis in samples analyzed by 450k methylation array (top, n=490) or single-end reduced representation bisulfite sequencing (RRBS-SE, bottom, n=388).
b. Eight gene expression clusters (ECs, columns) were identified by Bayesian non-negative matrix factorization (BNMF) method in 603 treatment-naive samples. Heatmap demonstrates associated upregulated (red) and downregulated (blue) marker genes for each cluster (rows) with select genes (right, see Supplementary Table 13). Right vertical panel demonstrates upregulated (red) or downregulated (blue) histone 3 lysine 27 acetylation (H3K27ac) in regulatory regions for each marker gene; EC-o and EC-i H3K27ac was not assessed due to low sample size (NA, gray). Header - number of samples in ECs; association with IGHV subtype (M-CLL, purple; U-CLL, orange); epitype (n-CLL, blue; i-CLL, yellow; m-CLL, red). Frequency of common CLL alterations is shown for each EC. Significant associations - asterisks (q<0.1, curveball algorithm, Methods).
c. Differential gene expression of tri(12)-positive and -negative cases in EC-m2 (top) and EC-u2 (bottom) compared to all other M-CLL or U-CLLs, respectively (EC marker genes shown in blue).
d. Dendrogram of ECs with associated upregulated and downregulated biologic pathways determined by gene set enrichment analysis (see Extended Data Fig. 9b).
e. Cellular proliferative history, represented by epiCMIT, varied in ECs enriched with m-CLL epitype. EC-m3 had significantly lower epiCMIT relative to EC-m1, EC-m2, and EC-m4 (p-values by two-sided t-test; unadjusted). The dashed red line marks the mean epiCMIT in all m-CLLs (n=404). Boxplots: center line, median; box limits, upper and lower quartiles; whiskers, 1.5x interquartile range.
