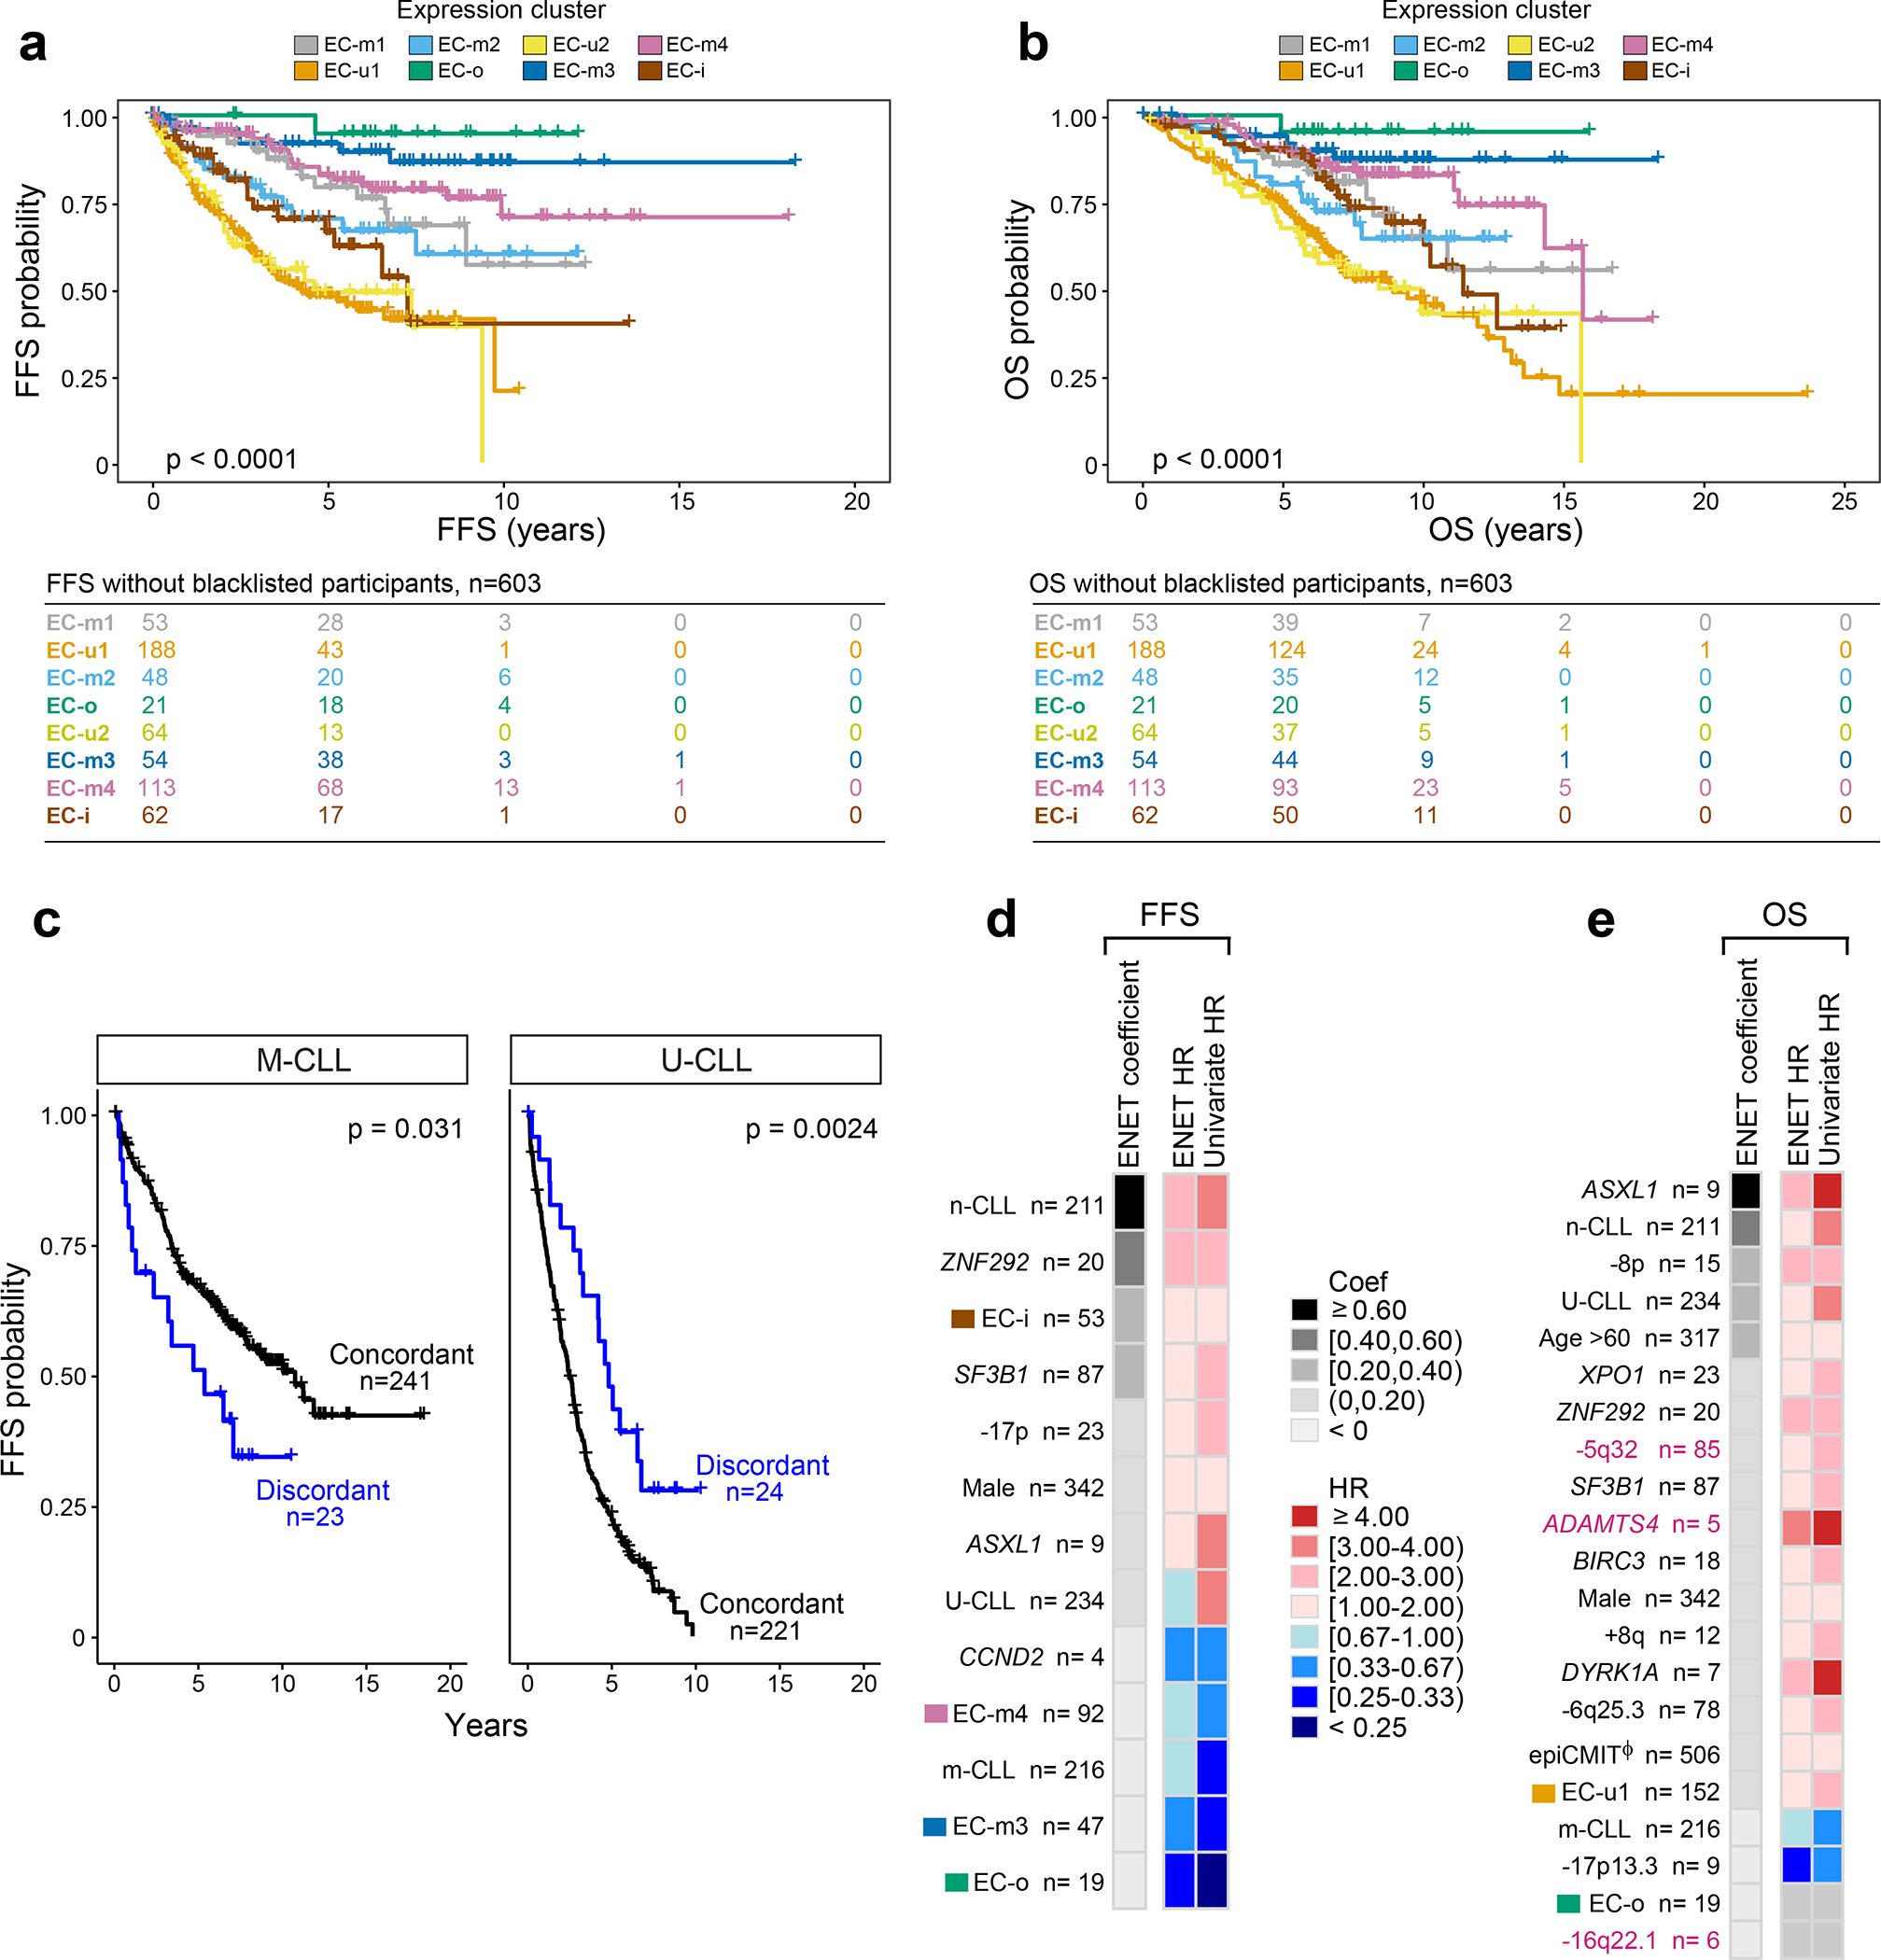
Figure 4: Expression clusters and integrated analysis predicts clinical outcome.

a-b. Kaplan Meier analysis of the impact of expression clusters on (a) failure free survival (FFS) and (b) overall survival (OS) probabilities in 603 treatment-naive samples (log-rank test).
c. Kaplan Meier analysis assessing the difference in FFS probability between samples with concordant IGHV status and ECs (e.g., M-CLLs in EC-m clusters) versus those that are discordant (e.g., M-CLLs in EC-u clusters). M-CLLs - left; U-CLLs - right. Log-rank test (two-sided; unadjusted p-values).
d-e. Genetic, epigenetic, and transcriptomic features associated with (d) FFS and (e) OS in treatment-naive samples (n=506). Events ranked by elastic net (ENET) coefficients, which identifies variables to be included in the model, shrinking coefficients to 0 when excluded. Heatmap denotes hazard ratios (HR) for ENET and univariate Cox regressions (see Supplementary Table 14). Continuous variable - Φ (epiCMIT).
