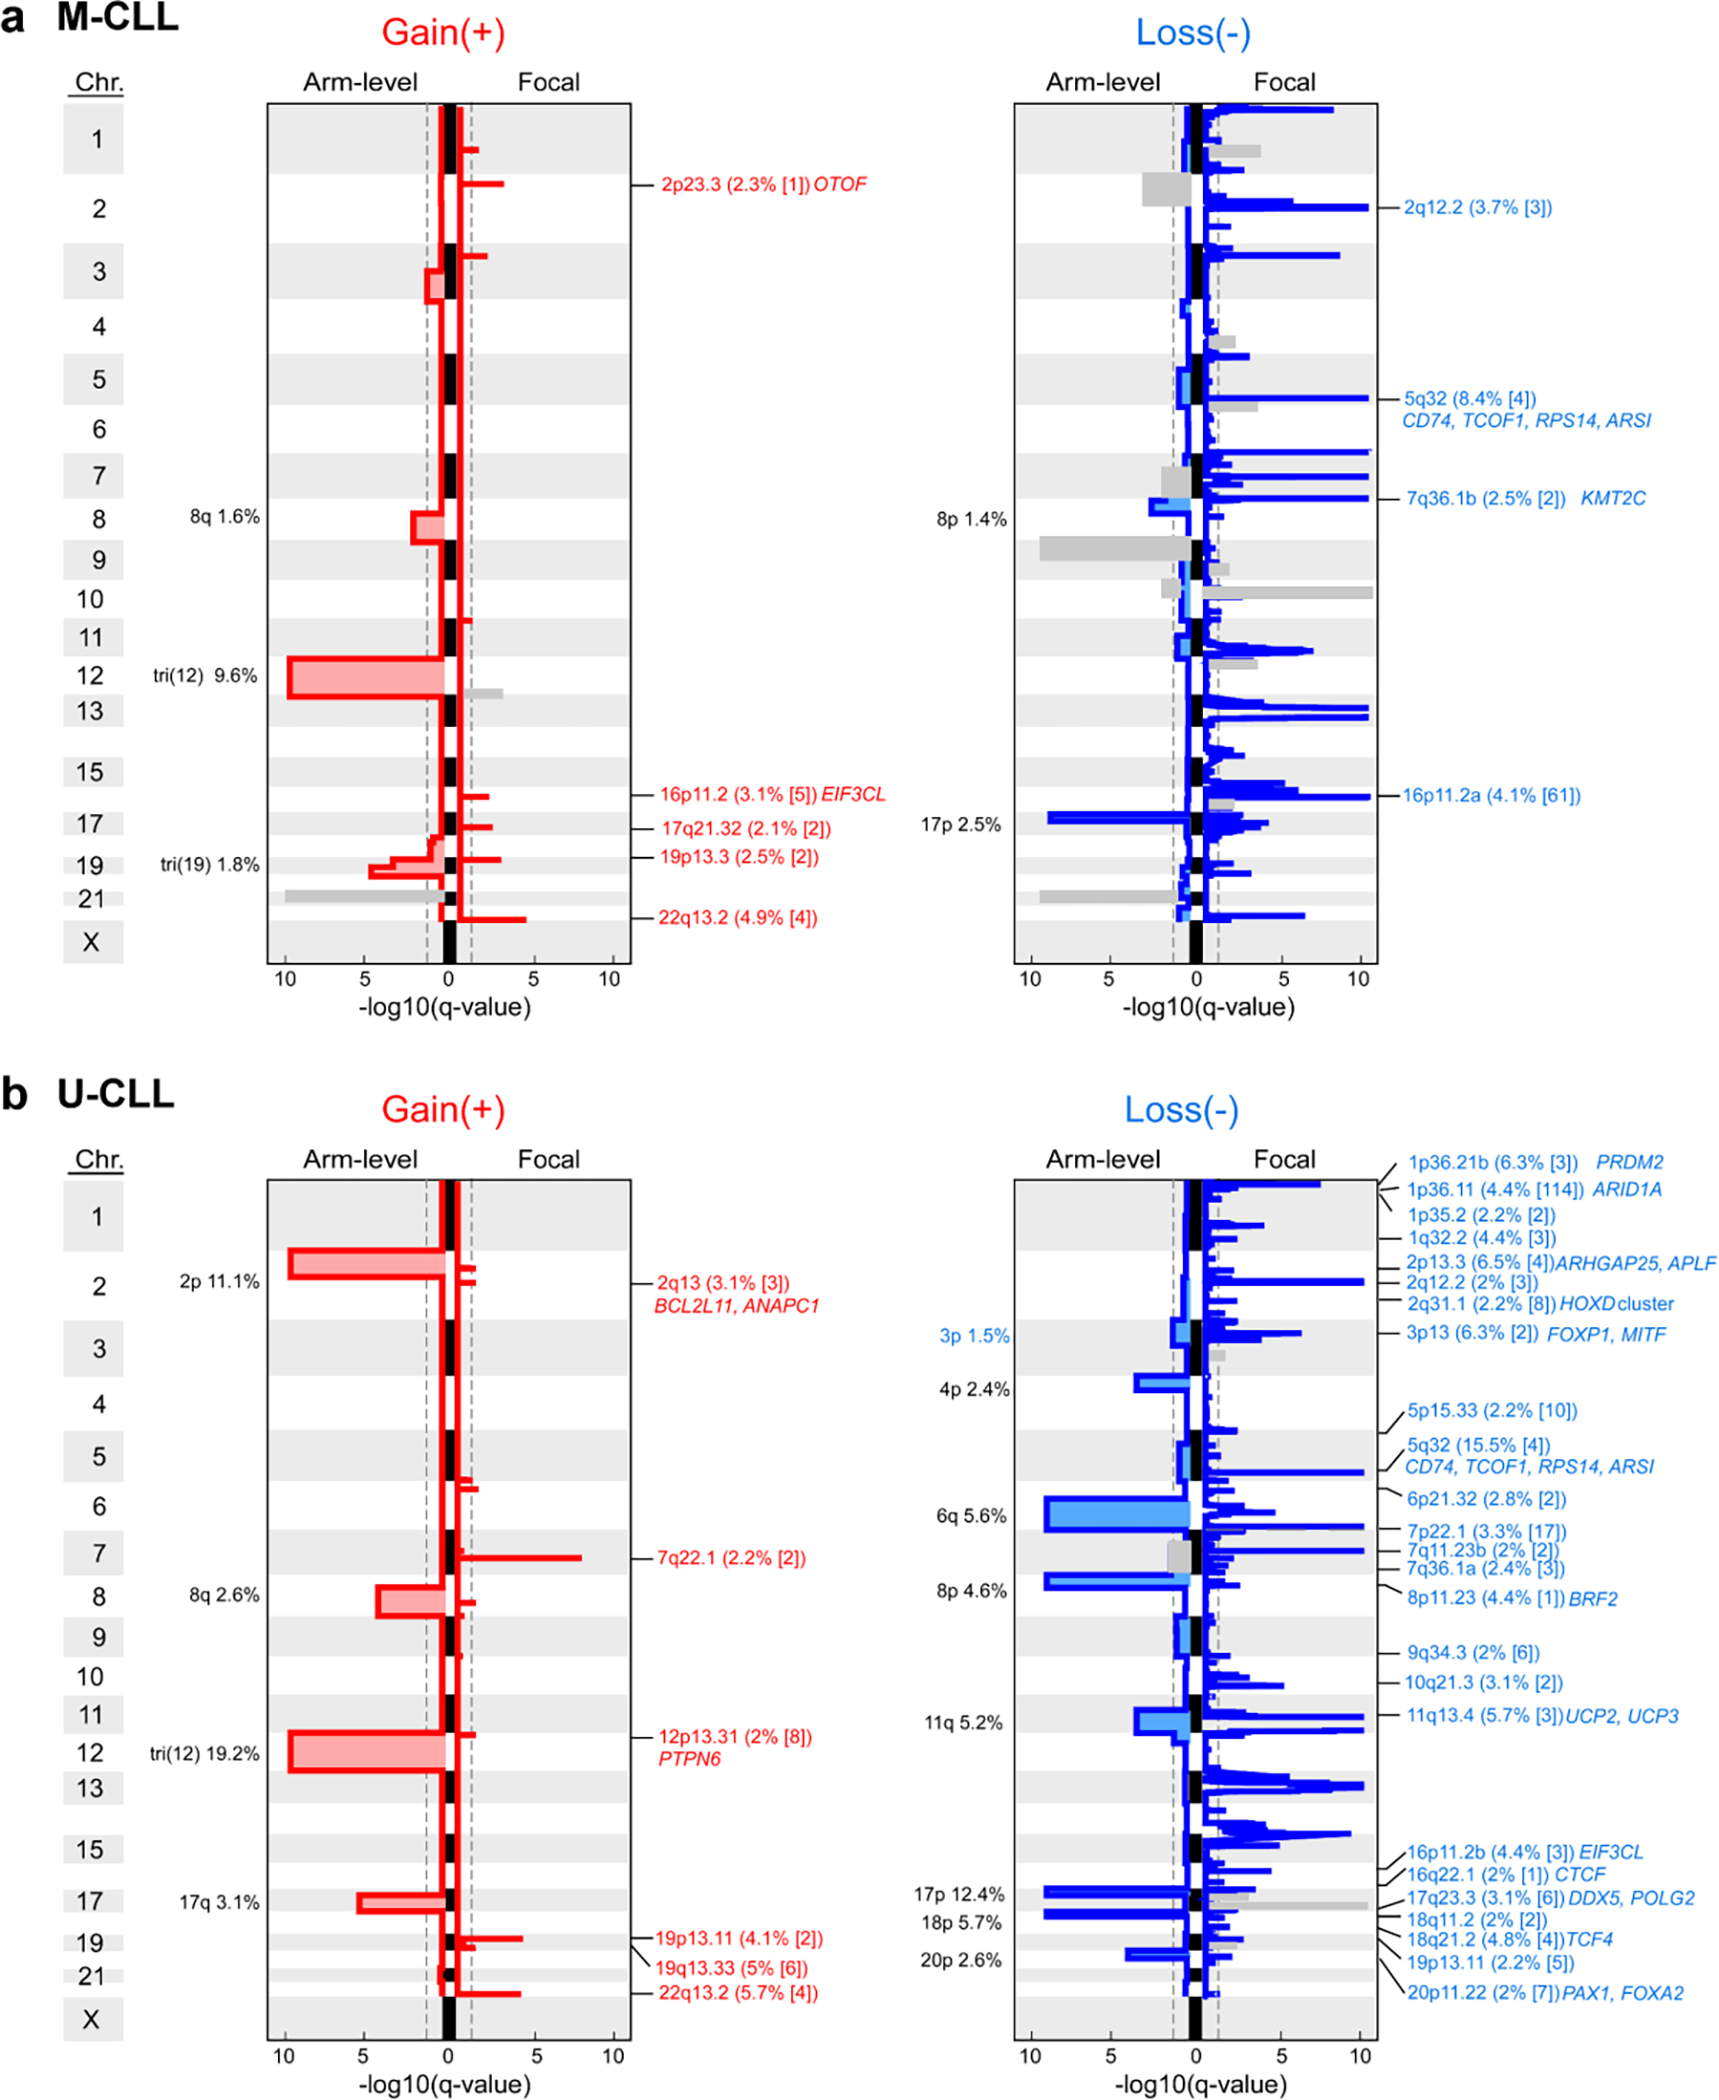
ED Fig 4. Chromosomal gains and losses identified in IGHV subtypes.

a-b. Recurrent copy number gains (left) and losses (right) by GISTIC analysis showing arm level (left per plot) and focal events (right per plot) in M-CLL (a, n=512) and U-CLL (b, n=459). Chromosomes are labeled along the vertical axis; dashed line - significance at q=0.1. Blacklisted regions are colored gray. All arm level events are labeled with cytoband arm and frequency in cohort. Focal events are annotated by cytoband, frequency, number of genes encompassed in peak (bracketed), and genes of interest. Red/blue font: novel focal events with frequency >2%. Black font: previously identified events (see Supplementary Table 7).
