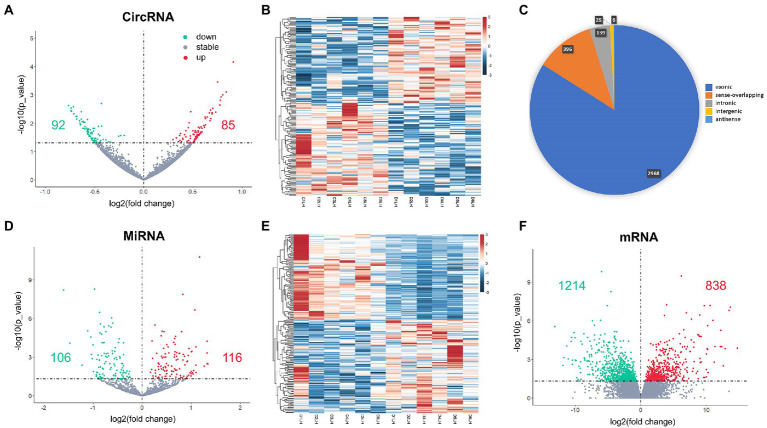
Figure 1.
DEcircRNAs (A,B), DEmiRNAs (D,E) and DEmRNAs (F) in the postoperative period. The classification of DEcircRNAs is shown as pie chart (C). Red dots in volcano plots are up-regulated genes and green ones are down-regulated genes. Red rectangles in heatmaps are up-regulated genes and blue ones are down-regulated genes.

