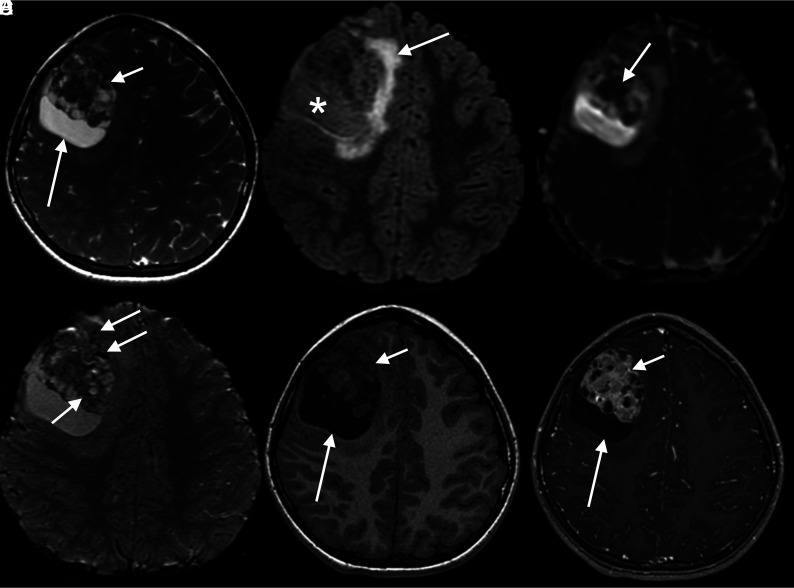
FIG 1.
MR images and tumor characterization on multiple sequences. A, Axial T2 image shows the right frontal solid-cystic mass, with large peripheral cysts (long arrow) and an eccentric bubbly-appearing solid component (short arrow). B, Axial FLAIR demonstrates that the signal intensity of the content of the peripheral cyst is not suppressed (asterisk), as well as mild perilesional edema (arrow). C, ADC map shows foci of intensely restricted diffusion on the anterior and solid aspect of the lesion (arrow). D, Axial SWI demonstrates foci of marked hypointensity (arrows), corresponding to punctate calcifications according to the filtered phase signal (not shown). E, Axial T1 image demonstrates an isointense to gray matter heterogeneous solid portion (short arrow) with a hypointense large peripheral cyst (long arrow). F, Axial T1 postgadolinium image shows intense heterogeneous enhancement of the solid part, with multiple small permeating cysts, giving the tumor a bubbly aspect (short arrow). The large peripheral cysts show no enhancement (long arrow).

