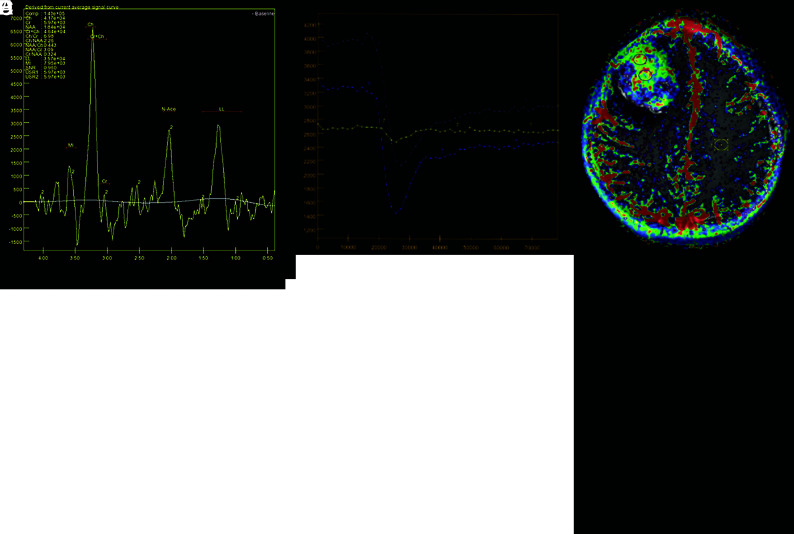
FIG 2.
Advanced MR imaging features. A and B, Axial relative CBV map and curves, respectively, show intensely increased perfusion (1.8×) within the solid part of the tumor, raising suspicion for a high-grade lesion. C and D, T1 perfusion Ktrans map and curves, respectively, demonstrate intensely increased permeability and Ktrans values in the enhancing portion of the lesion (0.170), suggesting increased capillary permeability. E, Proton spectroscopy shows an increased Cho peak, with increased Cho/Cr and Cho/NAA ratios, inferring cellular proliferation, as well as an increased lipid-lactate peak, suggesting anaerobiosis. LL indicates lipid lactate; USR1/2, Muon spin rotation; N-ace, N-acetylaspartate; MI, myoinositol.

