FIGURE 2.

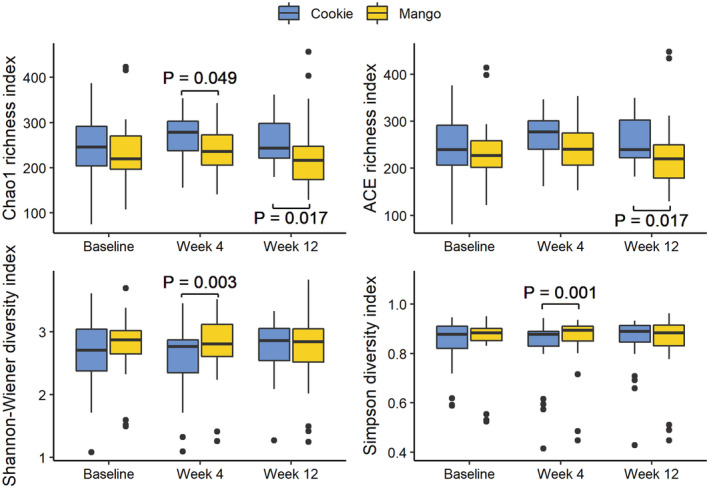
Alpha diversity measures of the microbiome. Box and the thick line therein denote quartiles and median. Whiskers extend 1.5 × interquartile range away from the first and third quartiles. Data beyond the whiskers are shown in dots.

Alpha diversity measures of the microbiome. Box and the thick line therein denote quartiles and median. Whiskers extend 1.5 × interquartile range away from the first and third quartiles. Data beyond the whiskers are shown in dots.