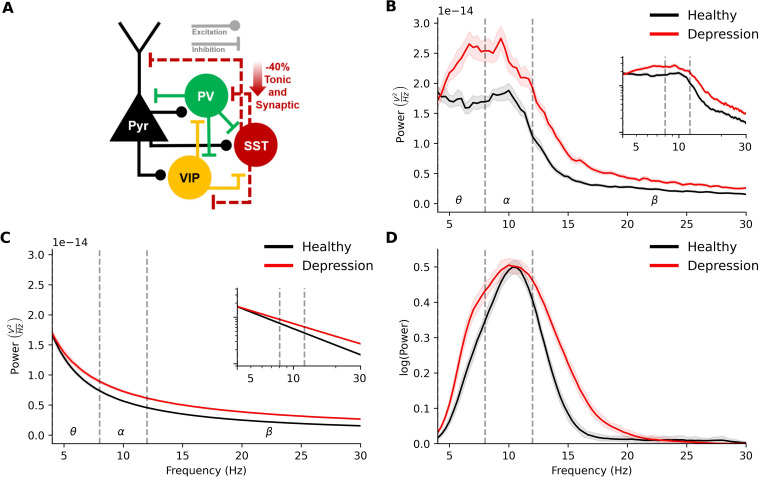
Fig 3. EEG signatures of reduced SST interneuron inhibition in depression microcircuit models.
(a) Schematic connectivity diagram highlighting the key connections between different neuron types in the microcircuit. In the depression condition, dotted lines from the SST interneurons illustrate reduced synaptic and tonic inhibition onto different neuron types. (b) Power spectral density plot of simulated EEG from the healthy (black) and depression (red) microcircuit models (n = 60 randomized microcircuits per condition, bootstrapped mean and 95% confidence interval). (c) Fitted aperiodic component of the PSD. (d) Fitted periodic component of the PSD.

