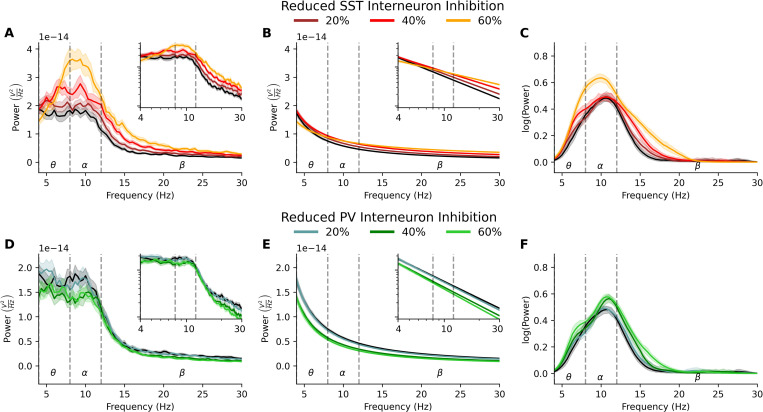
Fig 4. Distinct EEG signatures from reduced SST vs PV interneuron inhibition.
(a) Power spectral density plot of simulated EEG from the healthy (black) and reduced SST interneuron inhibition (depression, red) microcircuit models, with high-low opacity indicating a 20%, 40% and 60% reduction in inhibition (n = 30 randomized microcircuits per condition, bootstrapped mean). (b) Fitted aperiodic component of the PSD. (c) Fitted periodic component of the PSD. (d-f) Same as (a-c) but for microcircuits with reduced PV interneuron inhibition.

