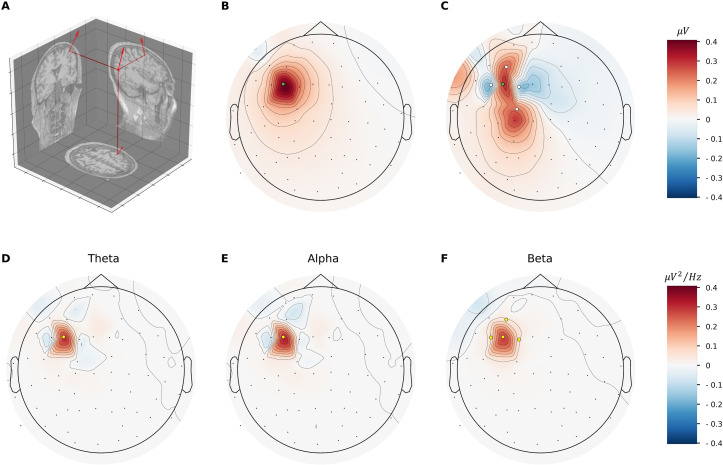
Fig 6. Topographic distribution of microcircuit EEG signal in a realistic head model.
(a) Microcircuit dipole placement and orientation in the grey matter of the dlPFC in a realistic head model, perpendicular to the cortical surface. (b) Potential spread of the EEG signal from the microcircuit source placed under the F3 electrode (green dot) to the EEG electrodes across the head. (c) Example timepoint of scalp potentials from multiple sources placed under AF3, F7, F3, FC1 electrodes (white dots) surrounding the dlPFC source. Color bar applies to panels b–c. (d) Distribution of the difference in spectral power from depression versus healthy simulated multi-source signals for theta band (4–8 Hz). Color bar applies to panels d–f, representing difference in power with a scaling factor of 1e-9. (e) Same as (d) but for alpha band (8–12 Hz). (f) Same as (d) but for low-beta band (12–16 Hz).

