Figure 3.

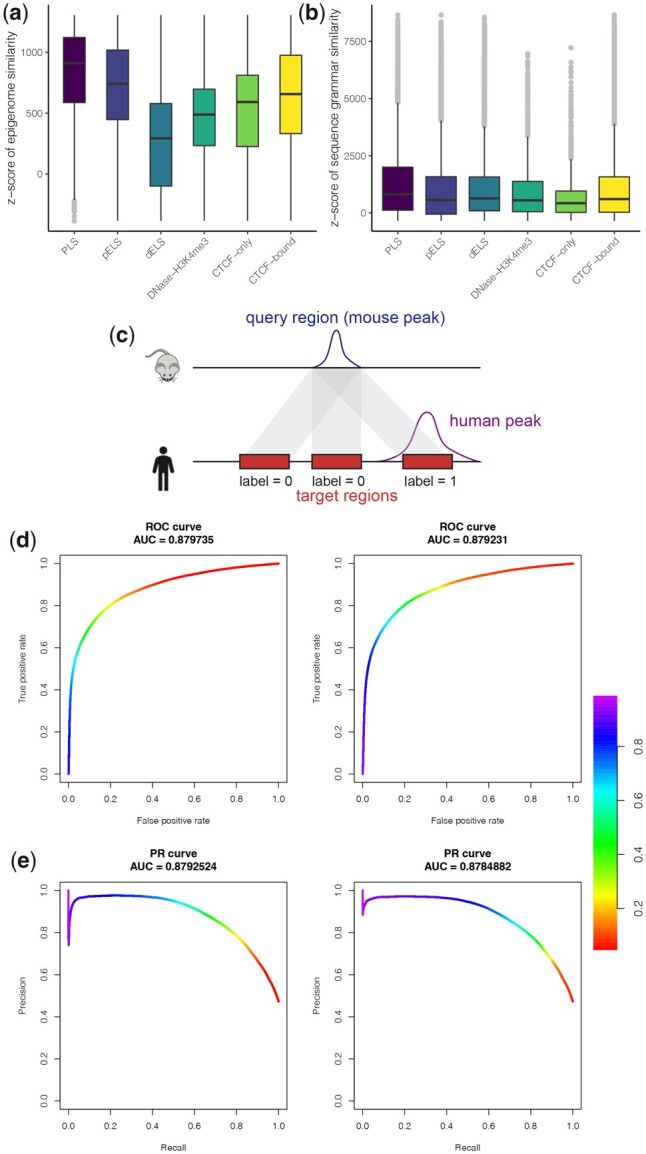
(a and b) Regulatory information similarity between orthologous cCREs. X-axis: six cCRE categories. A null distribution for each of the similarity scores is estimated by randomly permuting cCREs 10, 000 times. Observed similarity scores were transformed into z-scores using the mean and variance estimates of these null distributions. (a) The z-scores of the epigenomic feature similarity across the six cCRE categories. (b) The z-scores of the sequence grammar similarity across the 6 cCRE categories. (c) An illustration of labeling candidate target regions of a mouse query region with the corresponding human epigenome peaks. Positive and negative classes are represented by 1 and 0, respectively. The translucent connection bands represent candidate orthologous mappings. (d and e) The ROC and the PR curves with a local window size of 2 kb in the islet ATAC-seq study. Left panel: with the default parameters from the LOOCV experiments; Right panel: with the parameters from the refitted logistic regression. The color denotes the threshold for the logistic probability score
