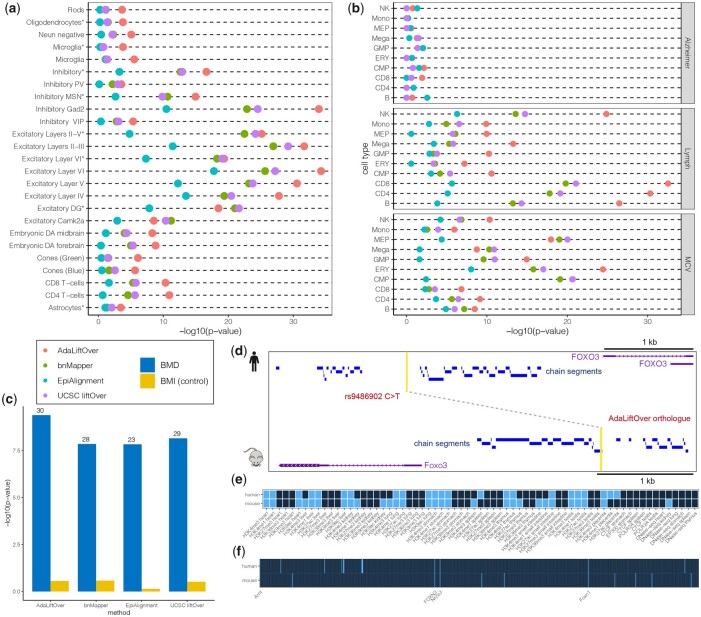
Figure 6.
(a) Enrichment analysis for fine-mapped Schizophrenia GWAS SNPs with respect to ATAC-seq peaks from 25 cell populations. (b) Enrichment analysis for fine-mapped GWAS SNPs from three traits (Lymph and MCV are hematopoietic traits, Alzheimer is a control trait) with respect to 10 hematopoietic ATAC-seq peaks. Lymph: lymphocyte count; MCV: mean corpuscular volume. (c) Enrichment analysis for fine-mapped BMD GWAS SNPs with respect to 52 mouse BMD genes. BMI: body mass index (control trait). The numbers of BMD genes mapped are labeled on the top of each bar. (d–f) AdaLiftOver rescues and maps a BMD GWAS rs9486902 at the FOXO3 promoter in human to Foxo3 promoter in mouse. (d) The human GWAS and AdaLiftOver-derived mouse orthologue are highlighted and linked by a dashed line. The GWAS SNP rs9486902 fails to map using UCSC liftOver. (e and f) The binary epigenomic and sequence grammar feature profiles of the GWAS SNP and its AdaLiftOver orthologue. Light and dark shading denote 1 (overlap) and 0 (not overlap), respectively

