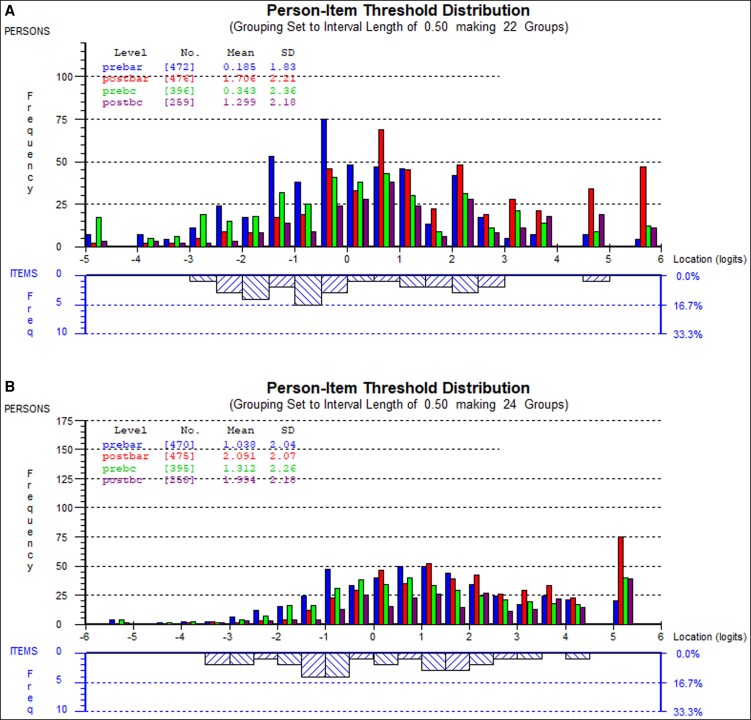
Figure 1.
Plots showing the group of patients and their ability levels (upper) and the item locations and their distribution (lower). In the middle part of the plots, the item locations for each scale were evenly distributed to match the range of the construct reported by the patients, while there are patients above and below the range of measurement captured within the items of the scales (the floor and ceiling effects). (A) Person-item threshold distribution map for the psychological scale. (B) Person-item threshold distribution map for the social scale. Prebar, pre-bariatric surgery; Postbar, post-bariatric surgery; Prebc, pre-body contouring surgery; Postbc, post-body contouring surgery; SD, standard deviation.

