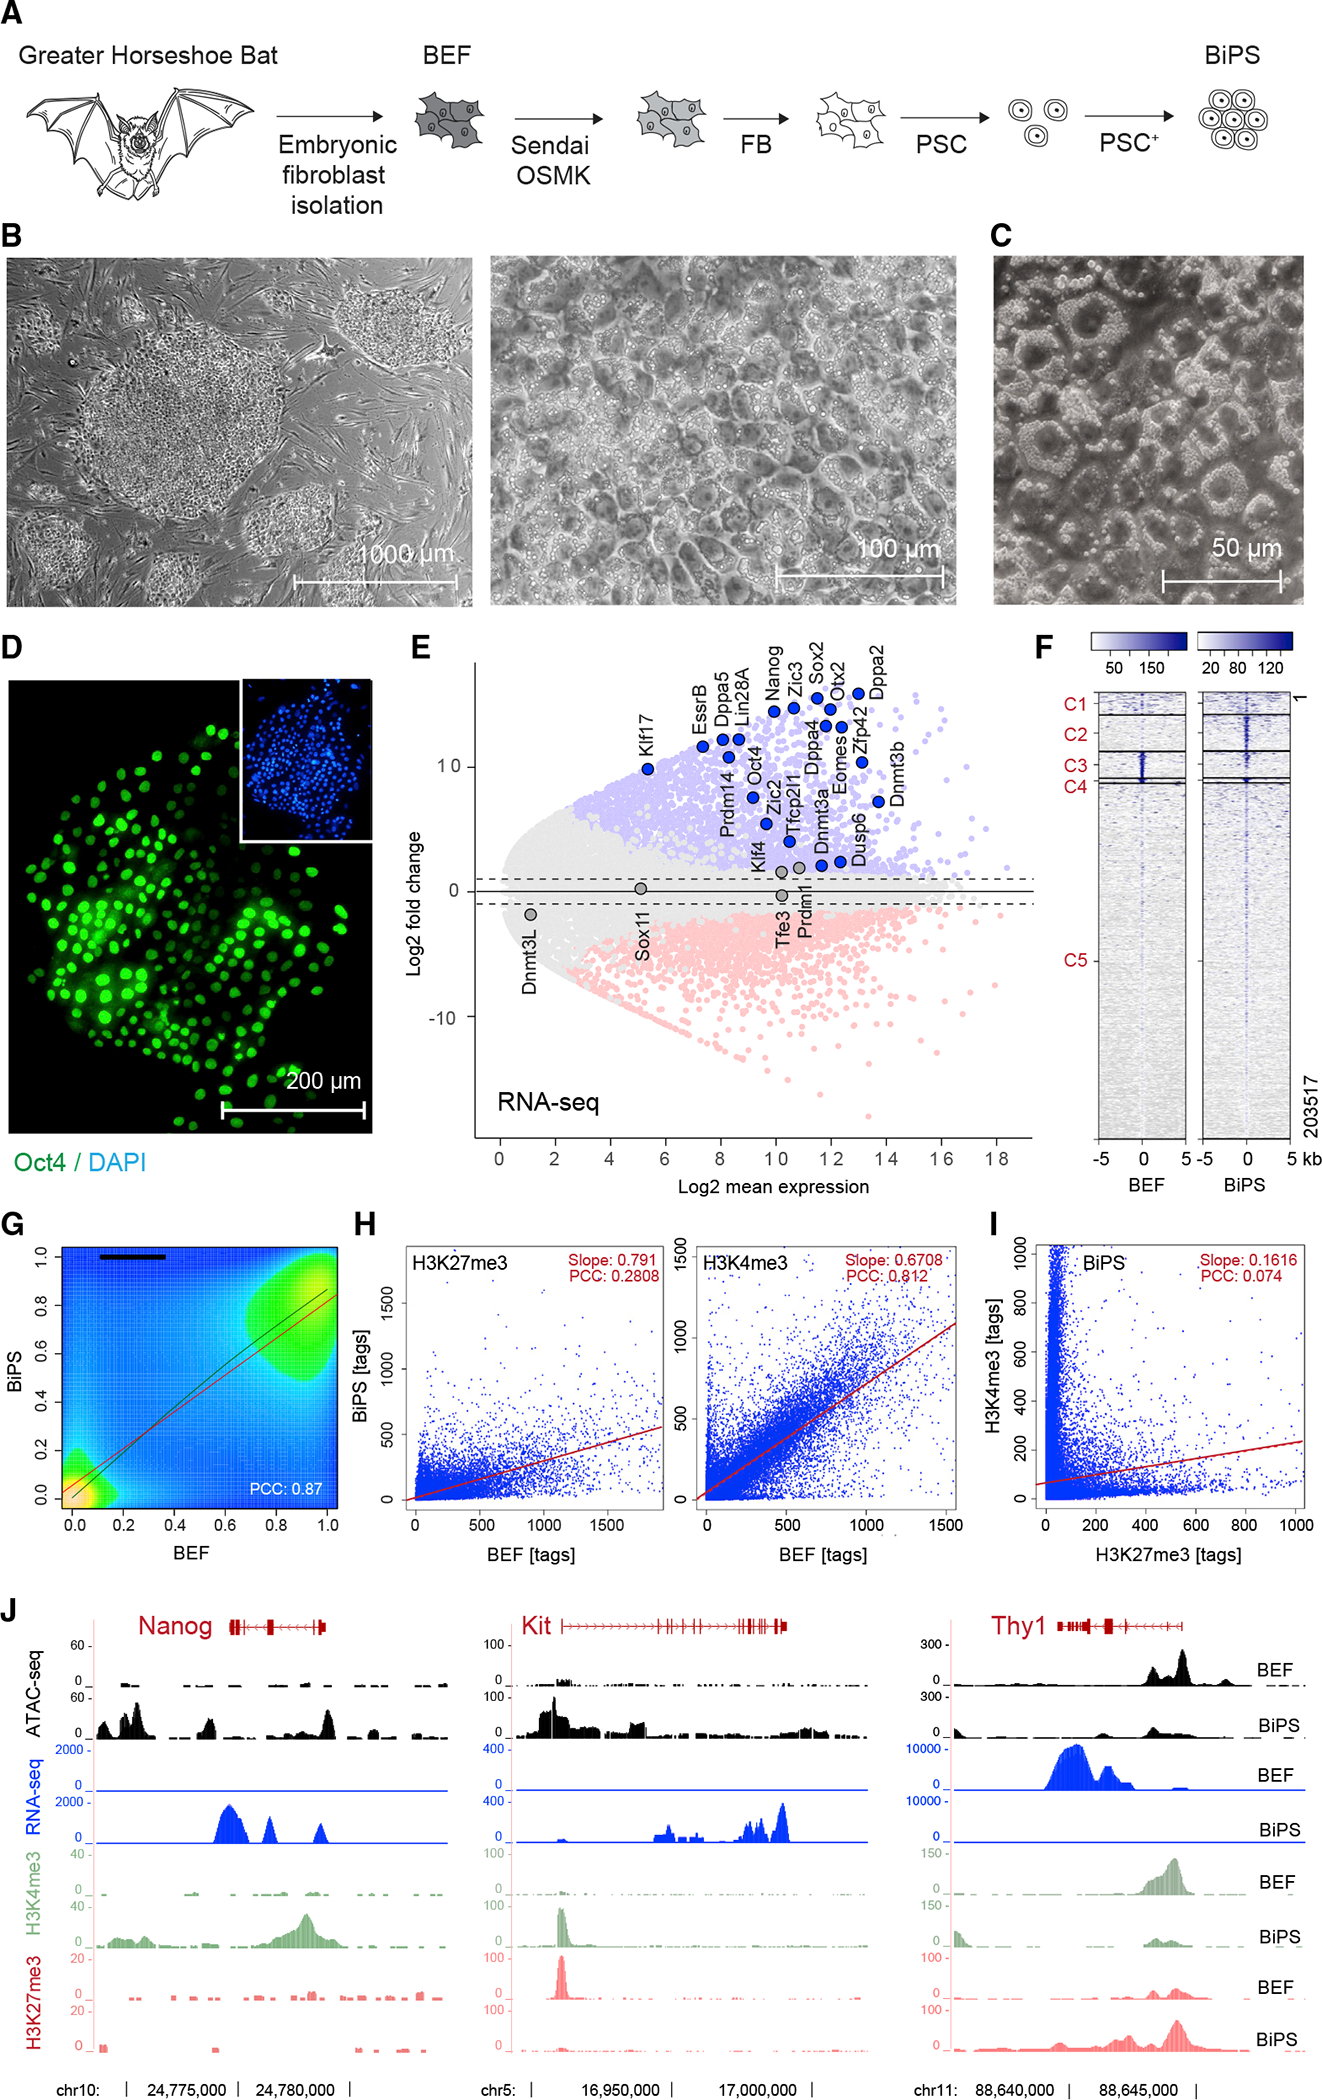
Figure 1. Derivation of pluripotent Rhinolophus ferrumequinum bat stem cells.

(A) Illustration of the bat pluripotent stem cell derivation strategy. BEF, embryonic fibroblasts; OSMK, Oct4, Sox2, cMyc, Klf4; FB, fibroblast medium; PSC, pluripotent stem cell medium; PSC+, PSC with additives.
(B) Microscopic images of bat pluripotent stem cells at different magnifications showing morphology of established BiPS cell colonies grown on mouse embryonic fibroblasts.
(C) Differential interference contrast microscopy image of BiPS cells highlighting prominent cytoplasmic vesicles.
(D) Immunofluorescent detection of Oct4 in BiPS cells.
(E) MA plot of RNA-seq data illustrating the transcriptional differences between bat embryonic fibroblast (BEF) and pluripotent stem cells (BiPS). Shown is the mean average of each gene from three replicates per cell type (n = 3). Selected genes with known functions in the establishment or maintenance of pluripotency are highlighted.
(F) Kmean cluster analysis of ATAC-seq signals obtained from BEF or BiPS cells. Shown is the representative result of one of two replicates per cell type. C, cluster.
(G) Density plot of RRBS results obtained from BEF and BiPS cells. Shown is the representative result of one of two replicates per cell type. PCC, Pearson correlation coefficient.
(H) Scatter plots of histone 3 methylation status at K4 (activating chromatin modification) or K27 (repressing chromatin modification) after ChIP-seq from BEF or BiPS cells, as indicated. Shown are the results of one sample for each chromatin mark.
(I) Scatter plot correlation of H3K4me3 and H3K27me3 in BiPS cells illustrating the occurrence of bivalent chromatin sites in BiPS cells.
(J) RNA-seq, ATAC-seq, and H3K4me3 or H3K27me3 ChIP-seq signals of selected genes with known roles in reprogramming that are activated (Nanog, Kit) or repressed (Thy1) in BiPS when compared with BEF cells. Shown are tracks of one representative sample.
