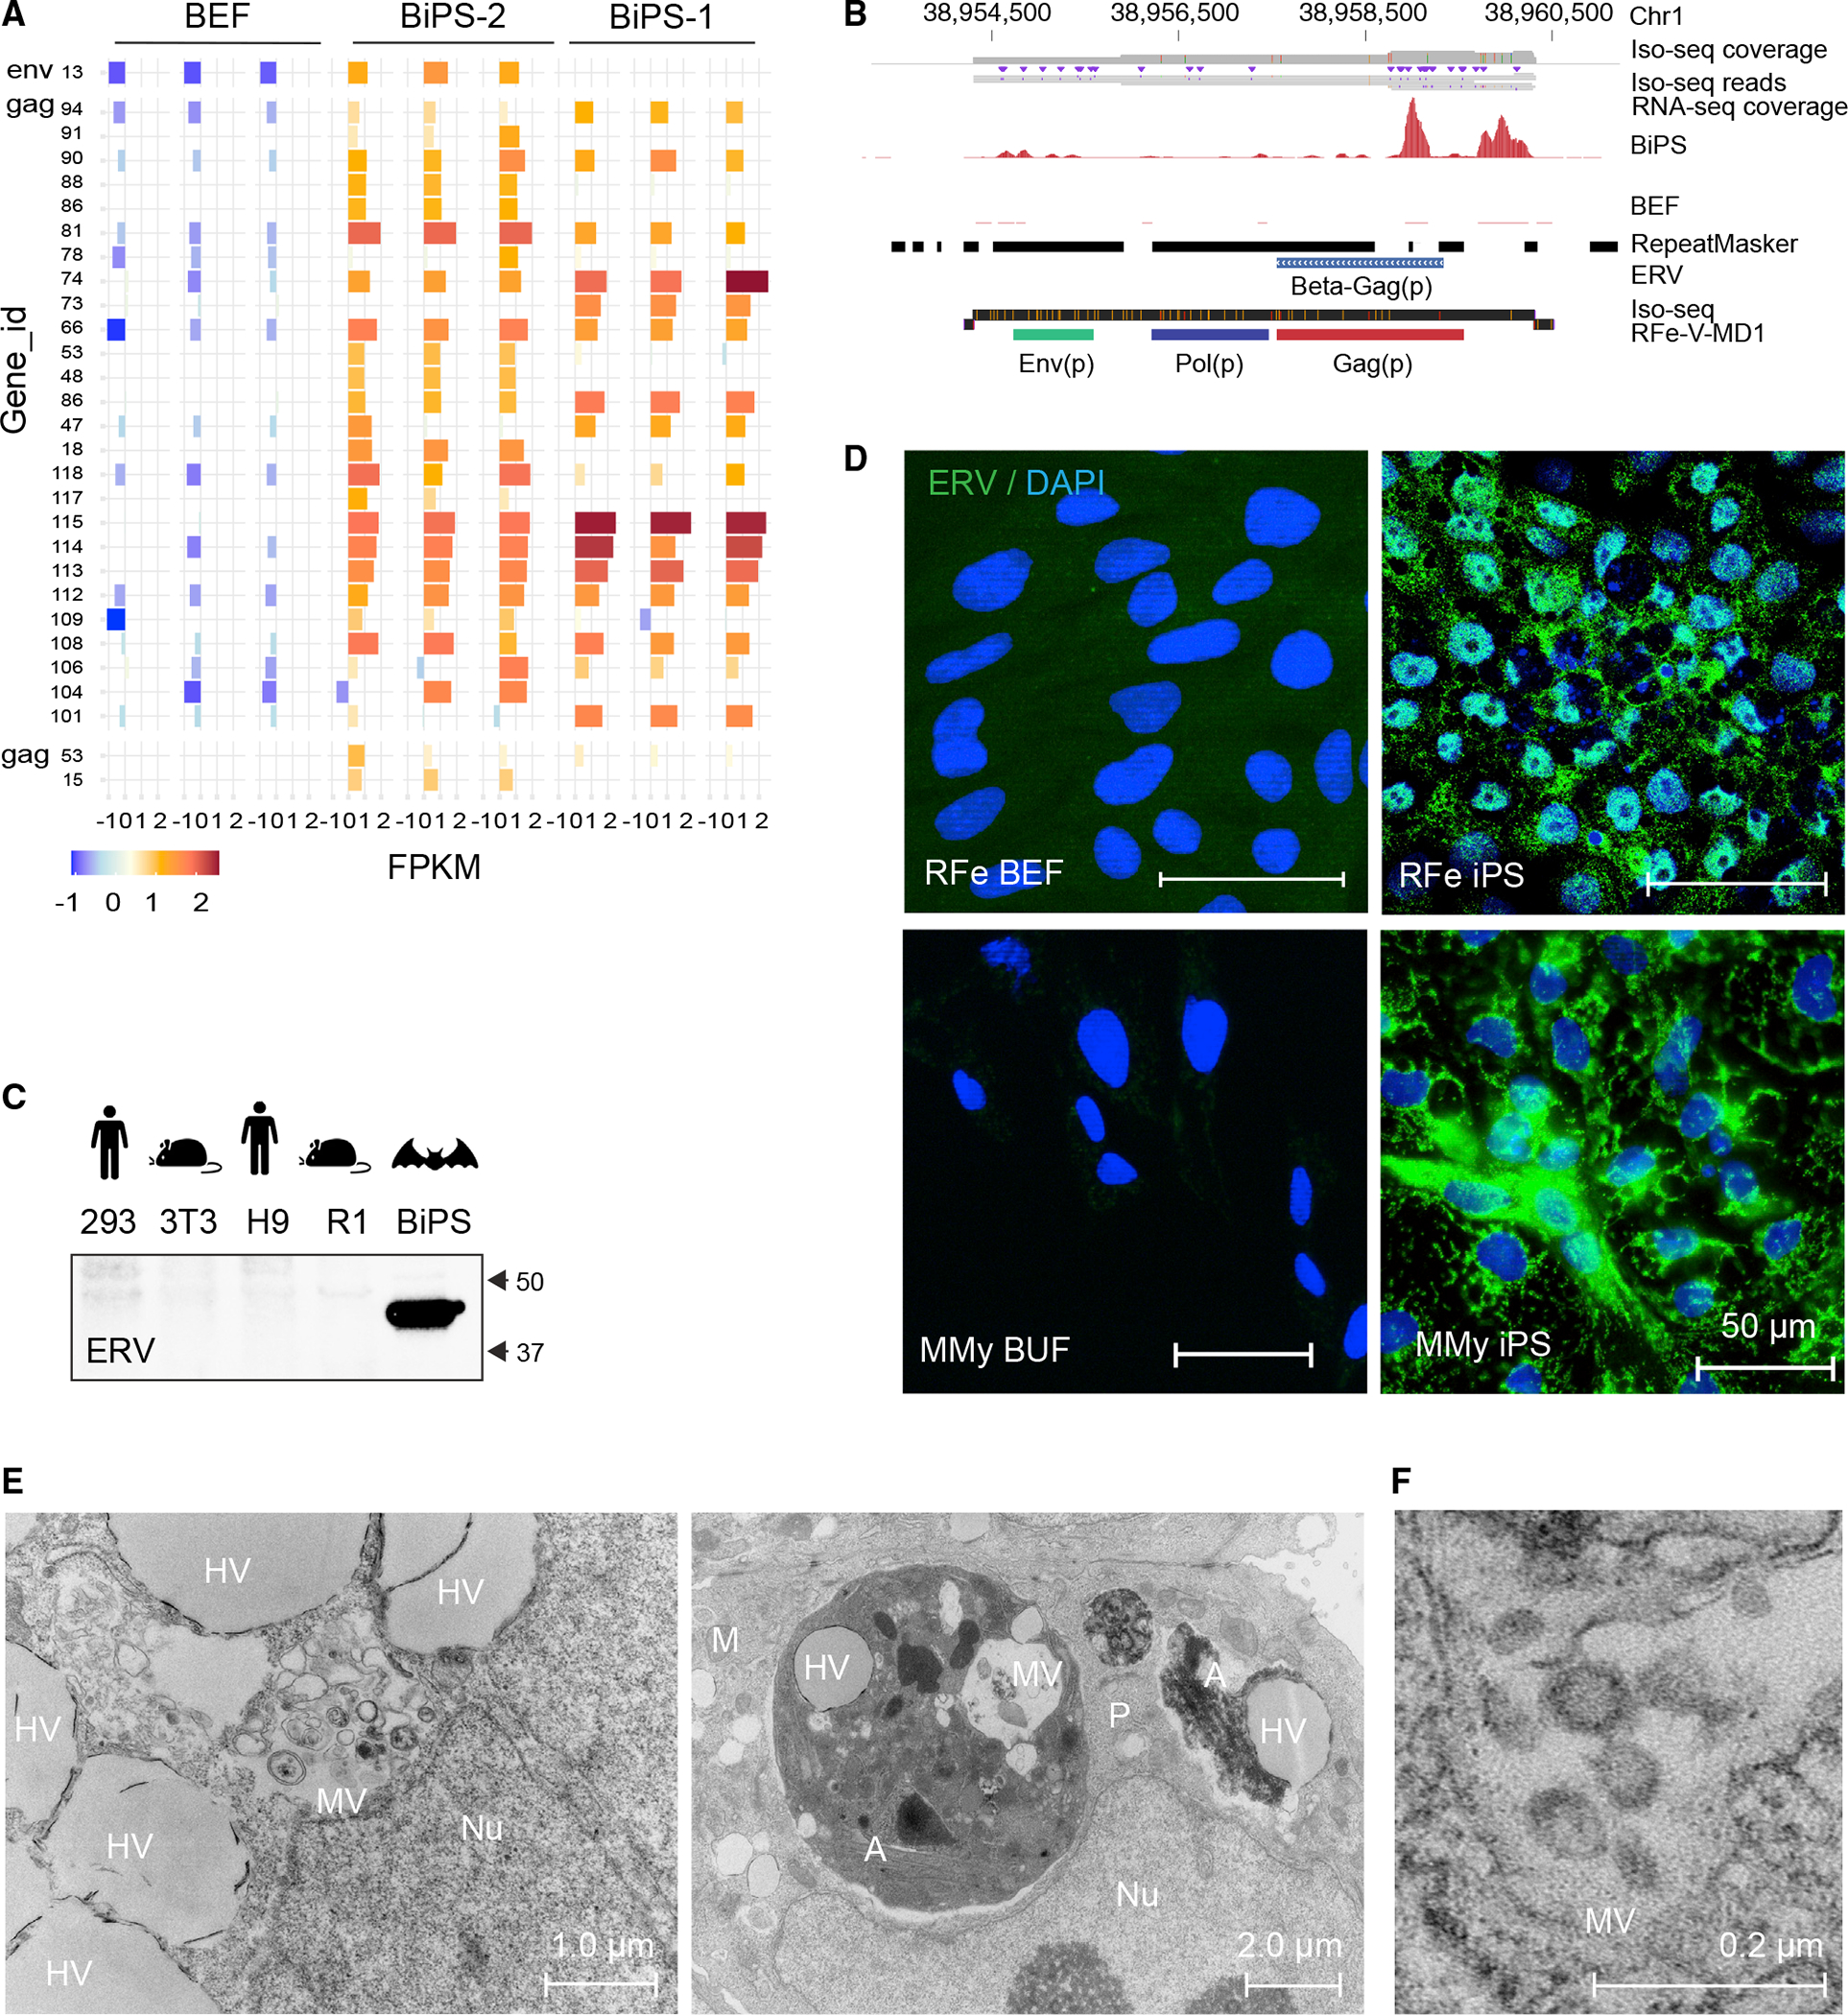
Figure 6. Reactivation of endogenized retroviral elements in bat induced pluripotent stem cells.

(A) Expression of indicated ERV elements in R. ferrumequinum bat embryonic fibroblasts (BEF) and iPS cells (BiPS), as determined by extracting the overlap between RNA-seq reads mapped to the R. ferrumequinum genome and known mapped ERV elements. Shown are the elements with the most evident differences (see Data Table S4A for a full list of expression data). All replicates (n = 3) per cell type are shown.
(B) RNA and Iso-seq sequencing tracks for an identified full-length retrovirus sequence, RFe-V-MD1, aligned to the R. ferrumequinum genome. The Iso-seq fragment represents a 6,088 bp-long transcript (ID: 39584940).
(C) Western blotting of protein lysates from human 293FT (kidney tumor cells) and human embryonic stem cells (H9), mouse 3T3 (fibroblasts) and mouse embryonic stem cells (R1), and R. ferrumequinum bat induced pluripotent stem cells (BiPS) with the endogenous retrovirus (ERV)-specific HERV K Cap antibody.
(D) Immunofluorescence images of R. ferrumequinum (RFe) bat embryonic fibroblasts (BEFs) and iPS cells from (top) and M. myotis (MMy) bat uropatagium fibroblasts (BUF) and iPS cells (bottom) after detection of the endogenous retrovirus (ERV) HERV K Cap protein (green); DAPI (blue).
(E) Overview of transmission electron microscopy of R. ferrumequinum bat pluripotent stem cells. MV, vesicles filled with multimembrane structures; HV, other vesicle structures filled with homogenous content; Nu, Nucleus; A, autophagosome; M, mitochondria; P, phagosome.
(F) Higher magnification of electron microscopy images as in (E) showing the presence of aggregates that are morphologically compatible with the appearance of endogenous retrovirus-like particles.
