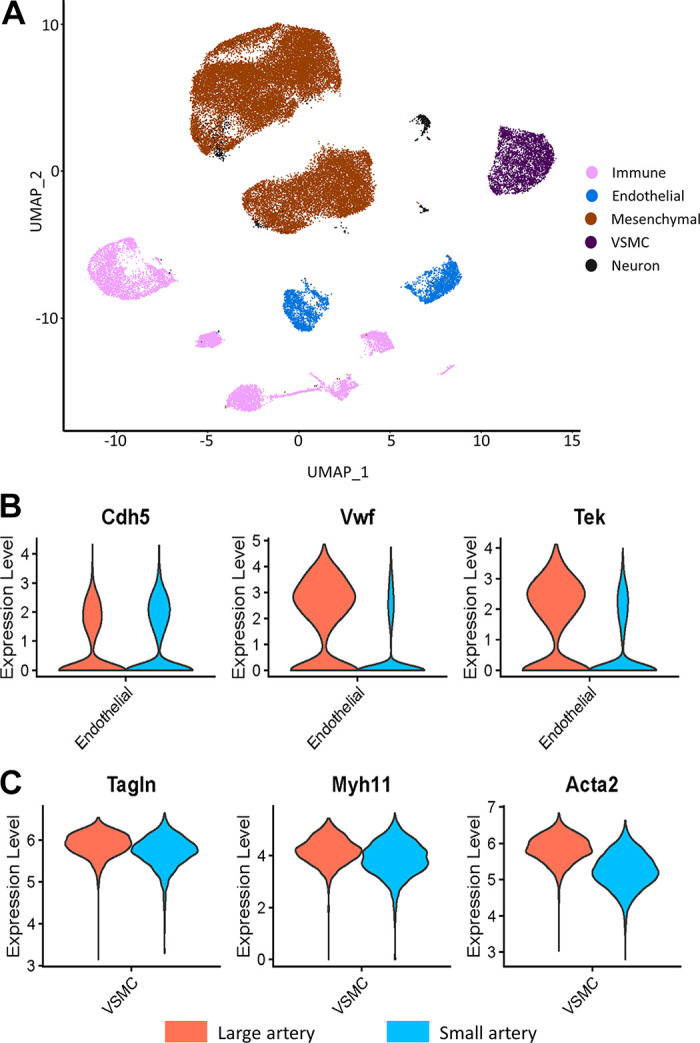
Figure 2.

Uniform manifold approximation and projection (UMAP) plot of in silico identified cells, color coded by cell type (A). Violin plots of the expression of gene markers confirming in silico identification of endothelial cells (ECs) (B) and vascular smooth muscle cells (VSMCs) (C). MSC, mesenchymal stem cell. For A, immune cells (pink), endothelial cells (blue), mesenchymal cells (brown), SMC (purple), neurons (black). For B and C, large (orange) and small (blue).
