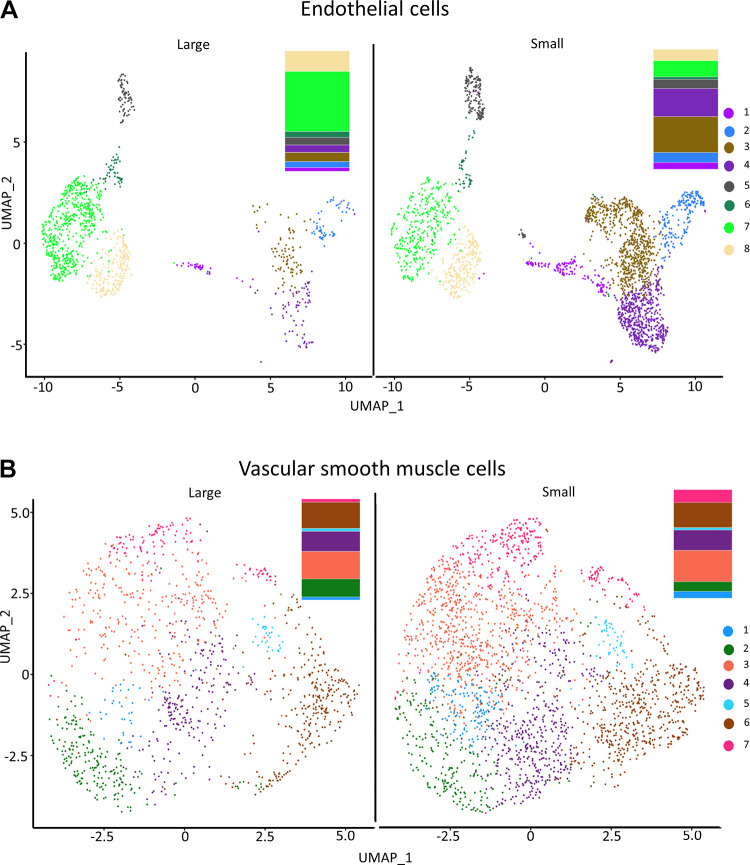
Figure 4.
Uniform manifold approximation and projection (UMAP) plot visualization of in silico identified endothelial cell (EC, A) and vascular smooth muscle cell (VSMC, B) subclusters in cells from large and small arteries color coded for the identification of EC and VSMC subclusters. Bar graphs showing the relative fractions (%) of each EC and VSMC subcluster are provided to the right of the UMAP plots.

