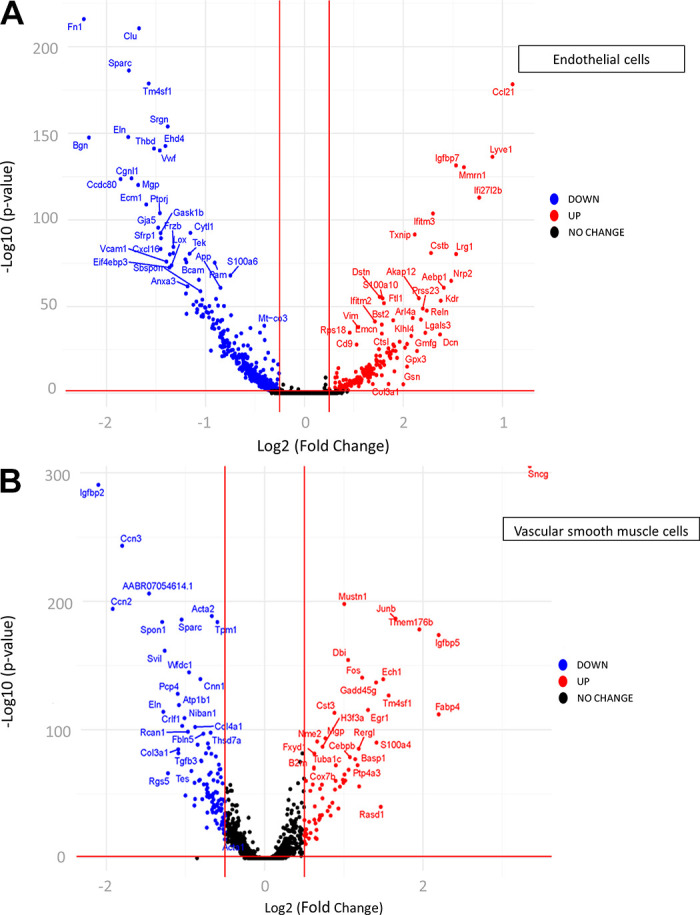
Figure 6.

Volcano plots of differentially expressed genes (DEGs) in endothelial cells (ECs, A) and vascular smooth muscle cells (VSMCs, B) between large and small arteries. Genes significantly downregulated (blue) or upregulated (red) in small compared with large. Labels are included only for genes with > 1 log2fold change.
