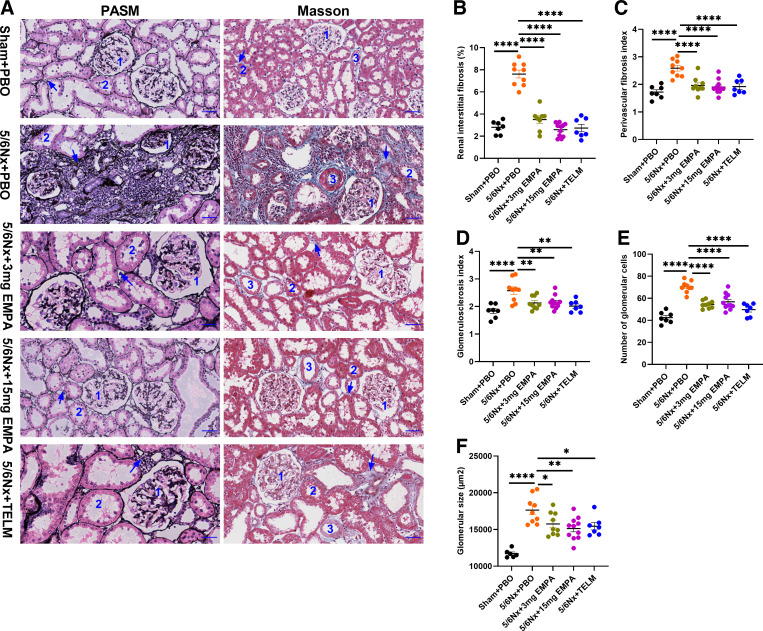
Figure 2.
Histopathological analysis of kidney compared with 5/6Nx + PBO group. A: representative micrographs of PASM and Masson staining of kidney sections from each group (×400, scale bar = 50 μm); Label 1: glomerulus; Label 2: renal tubules; Label 3: vascular; arrow: renal interstitial fibrosis. Renal interstitial fibrosis (%; B); perivascular fibrosis index (C); glomerulosclerosis index (D); number of glomerular cells (E); glomerular size (µm2; F). All these indicators were lower in the other groups [Sham + PBO (n = 7), 5/6Nx + TELM (n = 7), 5/6Nx + 3 mg EMPA (n = 9) and 5/6Nx + 15 mg EMPA (n = 11)] than in the 5/6Nx + PBO (n = 9) group. Values displayed are means ± SE. *P < 0.05; **P < 0.01; ***P < 0.001; ****P < 0.0001, significantly different from 5/6Nx + PBO. EMPA, empagliflozin; 5/6Nx, 5/6 nephrectomized rat model; PASM, periodic Schiff-methenamine staining; PBO, placebo; Sham, sham operation; TELM, telmisartan.

